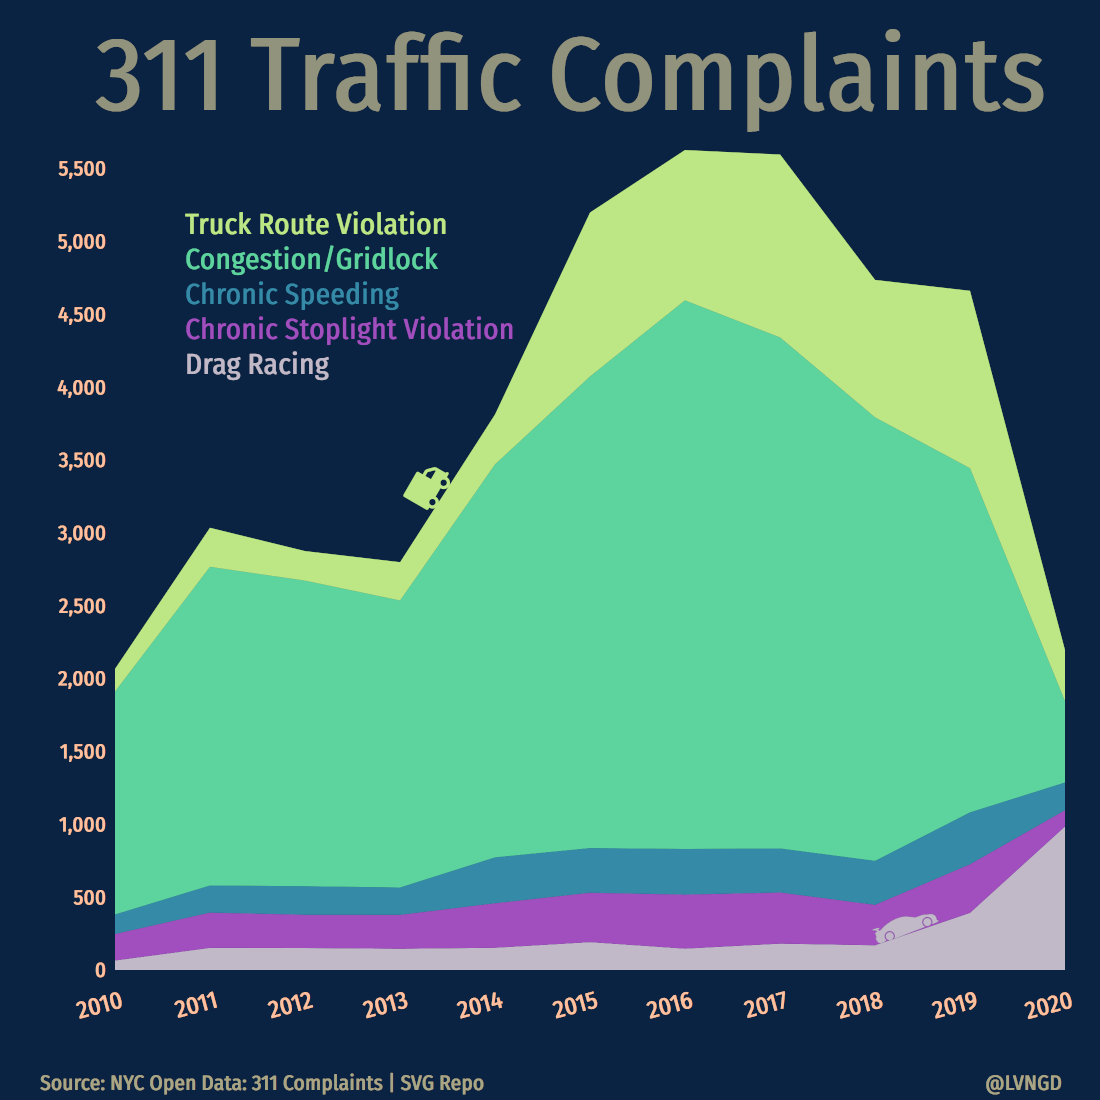
Creating static and interative visualizations to tell the whole story with your data.
I've worked with D3.js versions 3-5 to create many types of visualizations including network graphs with force layouts.
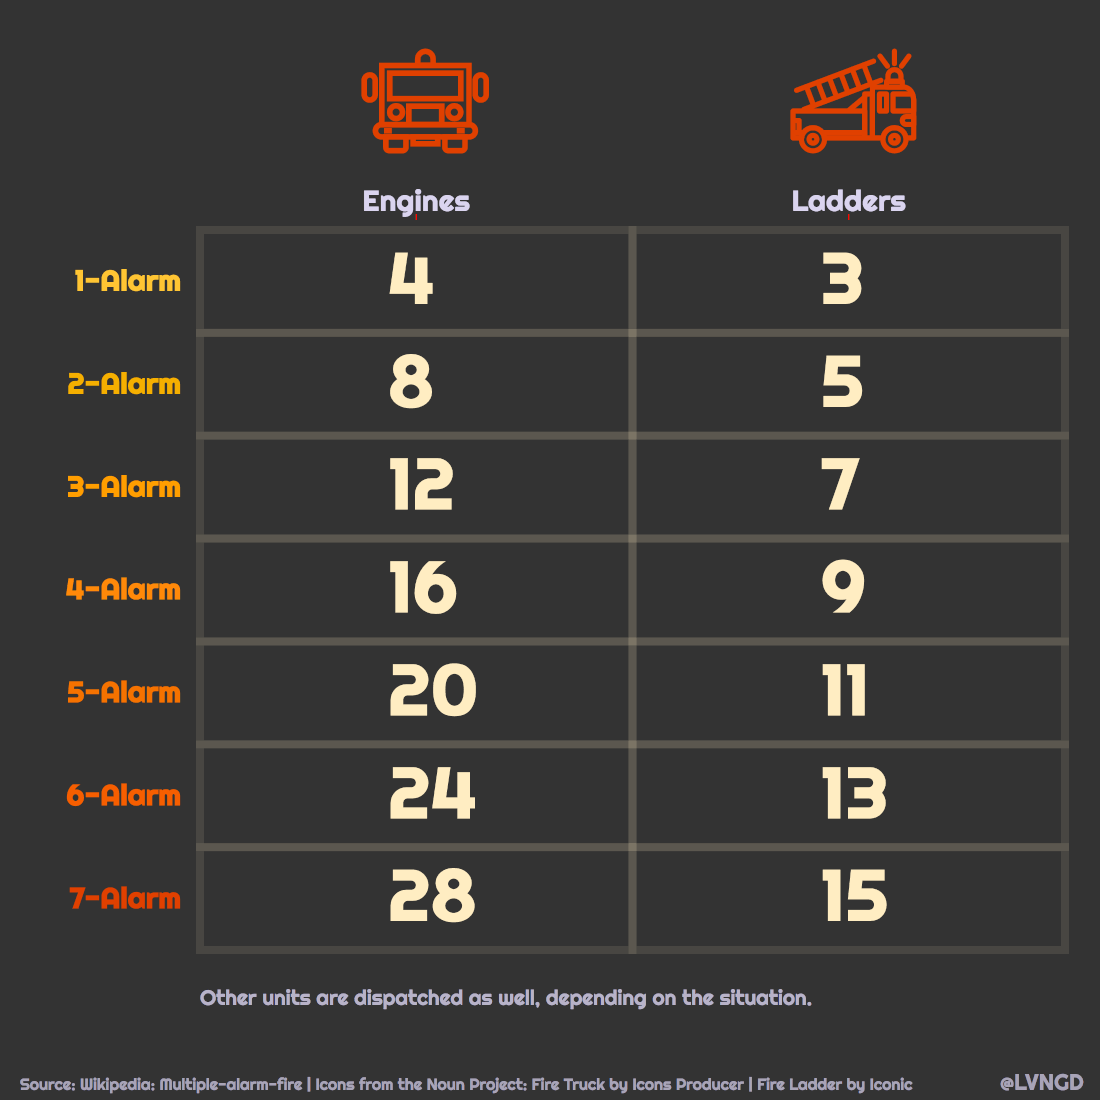
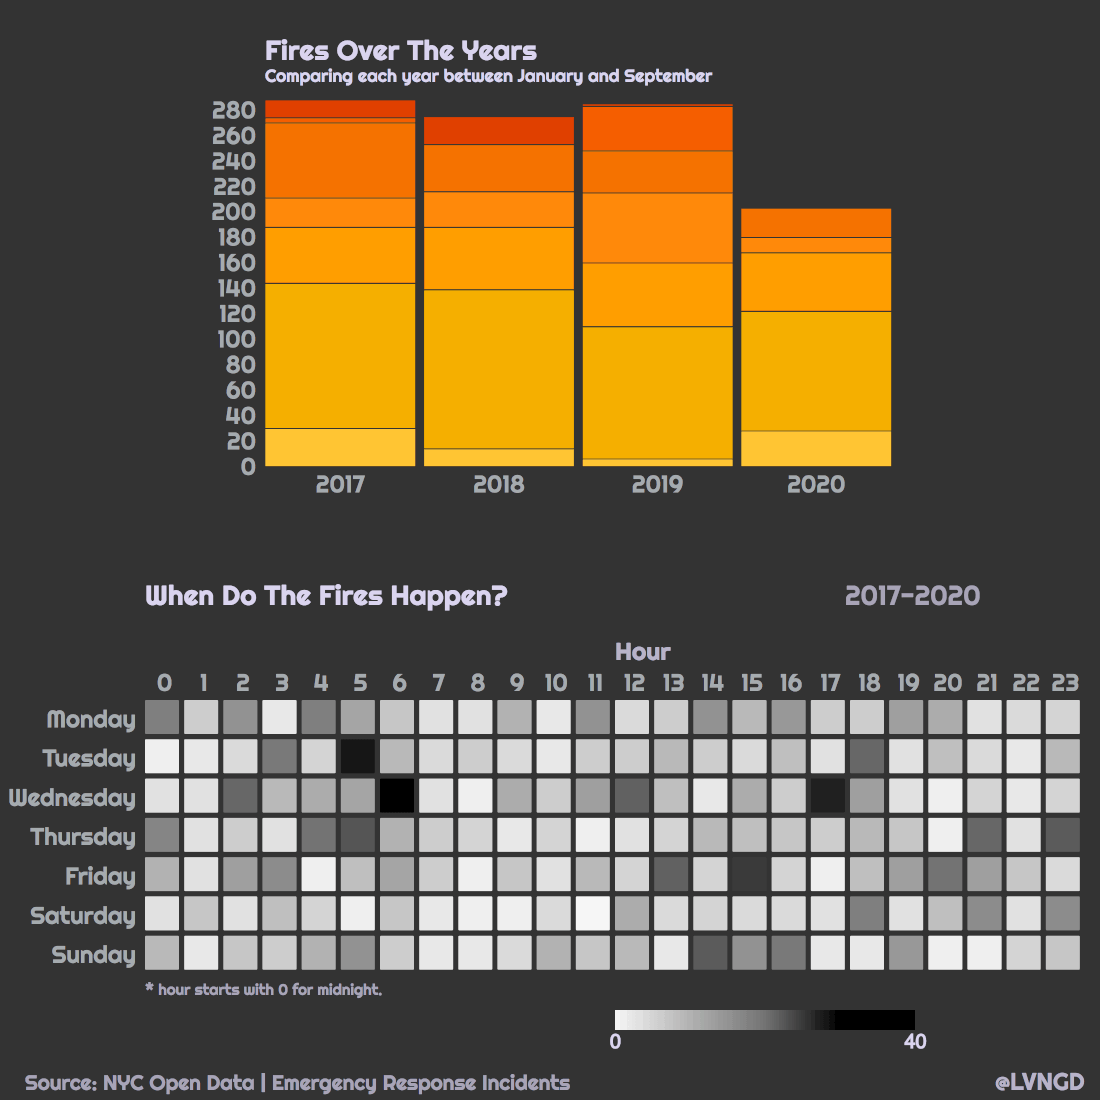
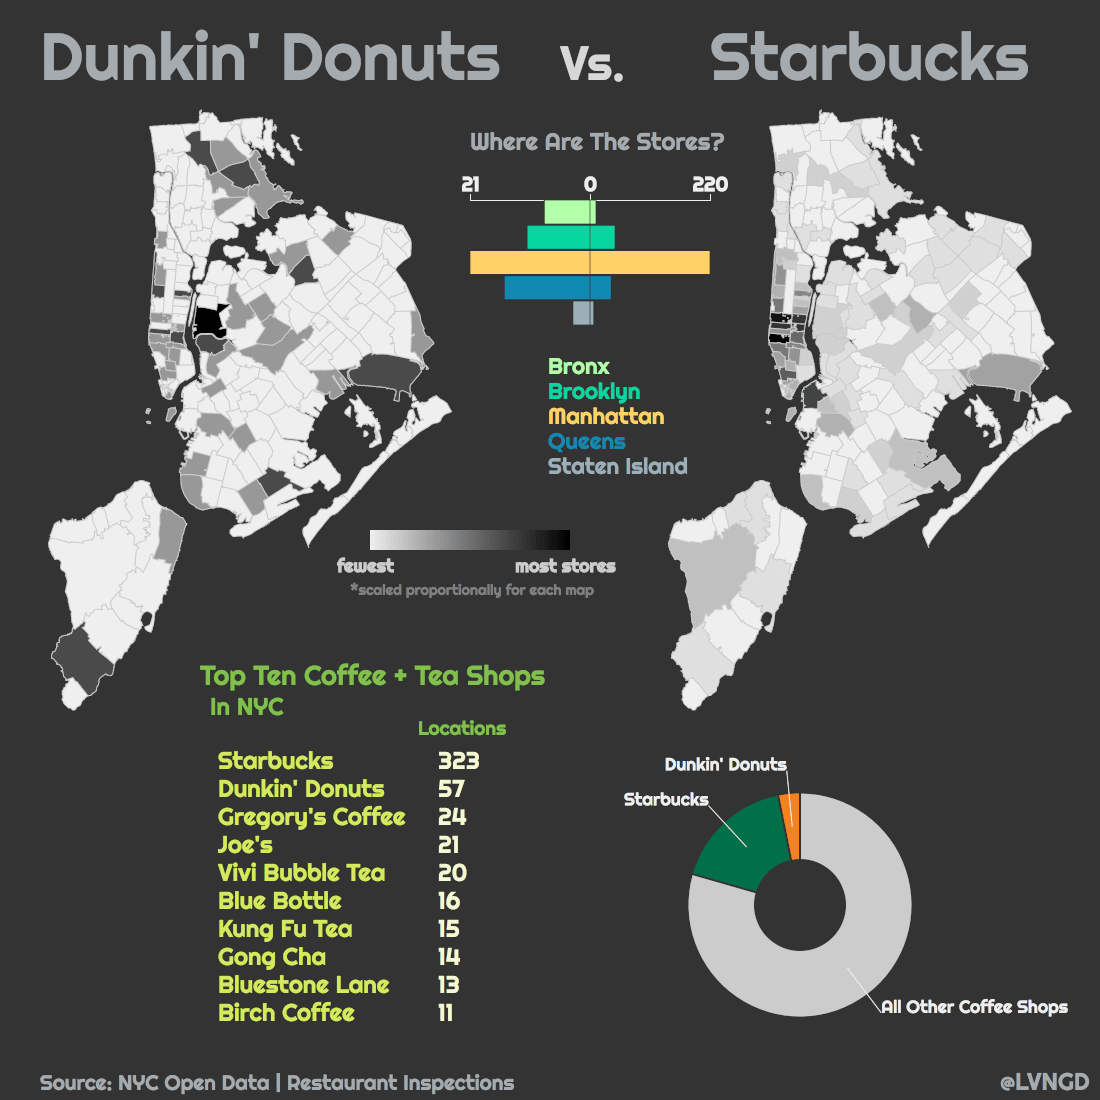
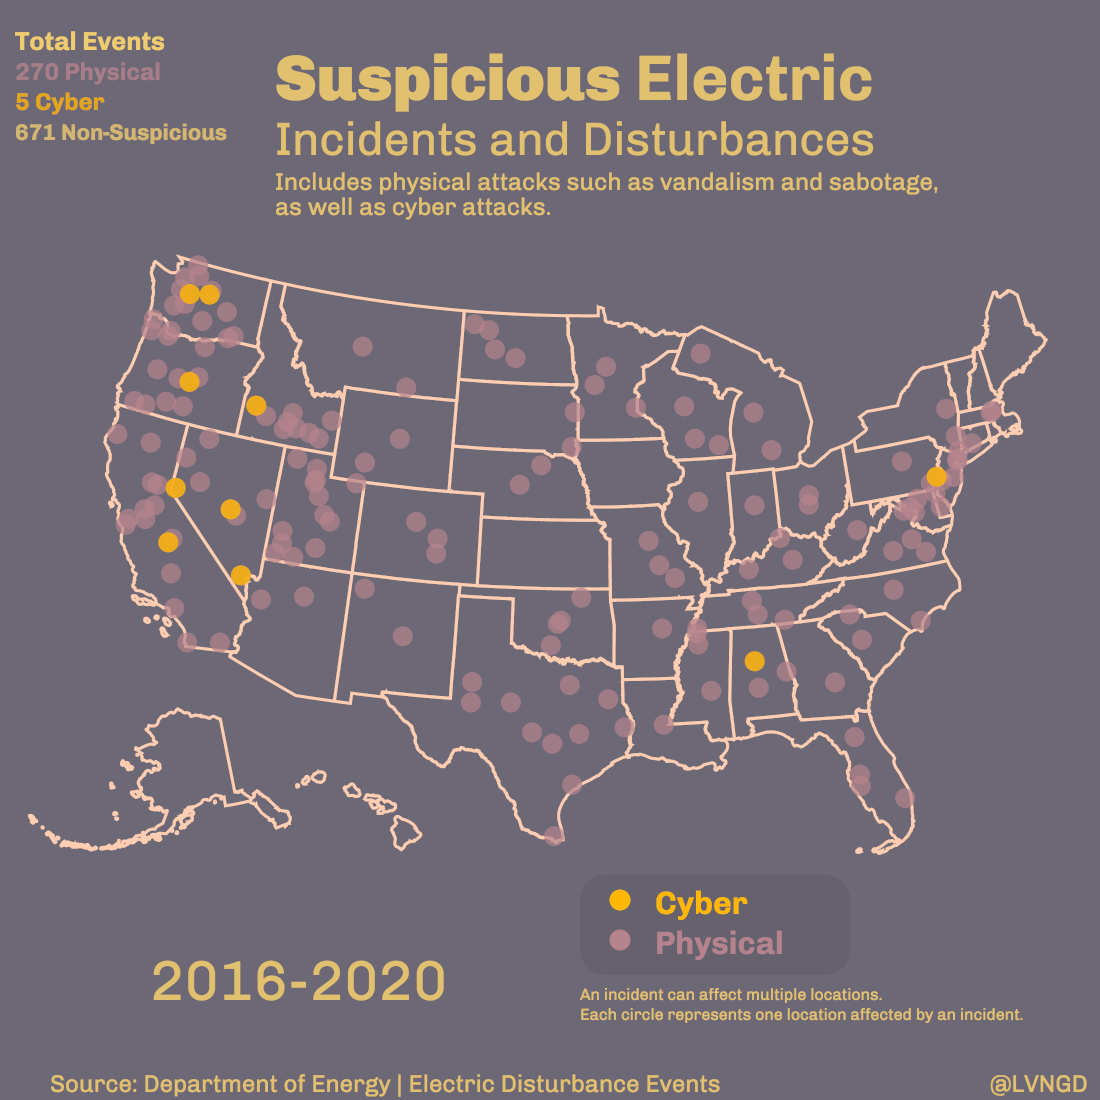
An infographic can help you say a lot about your data in a small amount of space.
Animations can help your audience see how your data changes and understand it better. They can also be very interesting and engaging!
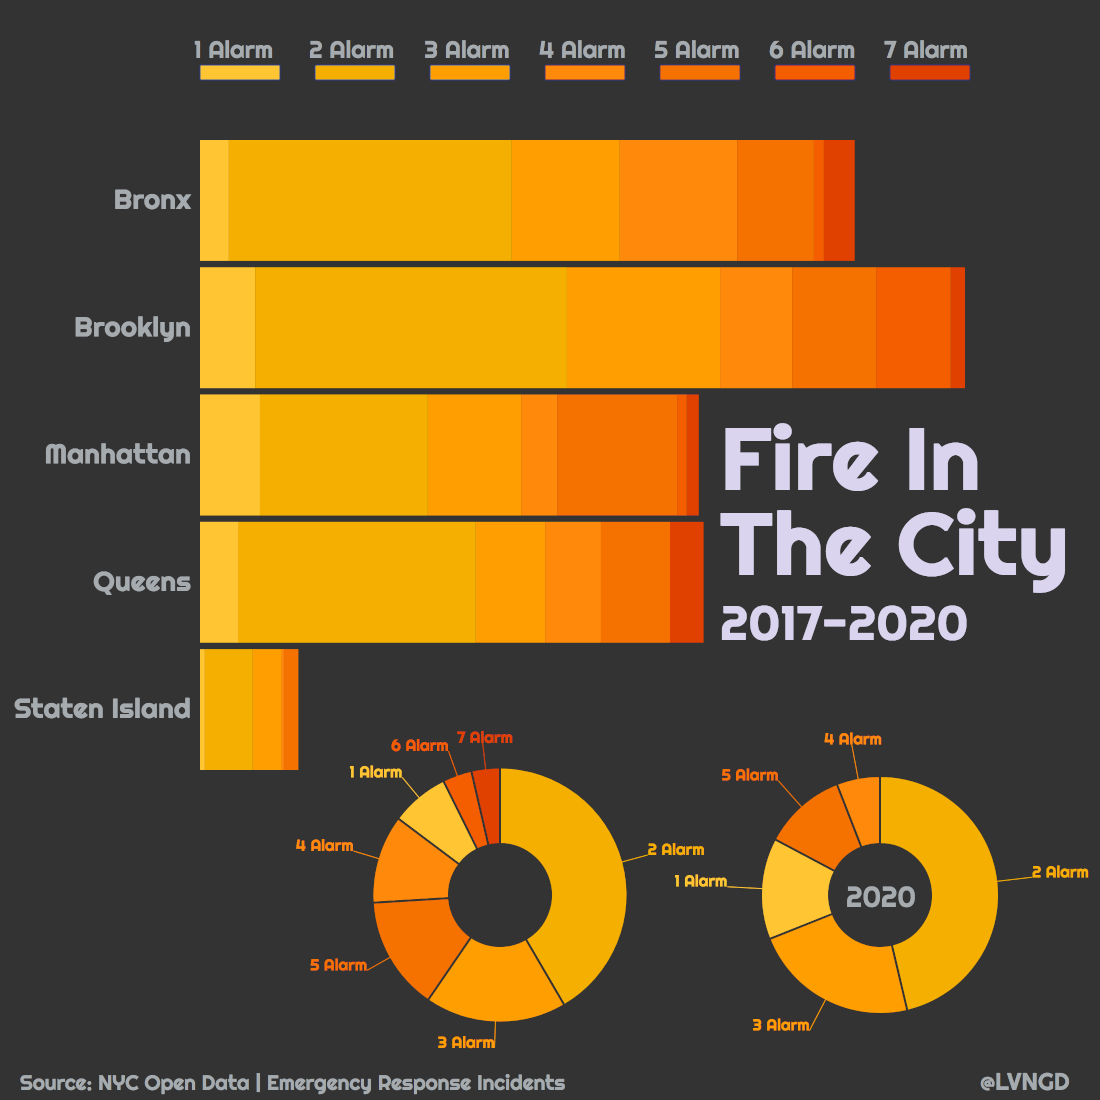
Extracting data from websites and APIs to compile a dataset that will drive your projects forward.
Collecting data from APIs such as Twitter, Google, open data sources, or from any other source that you might be using.
Web scraping using proxy IP rotation and other techniques to seamlessly collect data from websites.
Picking the best tool for the job. I work with Requests, BeautifulSoup, Selenium, Scrapy, and several others, depending on the project needs.
I'm an enthusiastic Python developer who can help you with data science and web development related projects.
Designing RESTful APIs using best practices, to serve as an interface between your data and users who are consuming it.
Cleaning and transforming your data with tools such as Pandas and NumPy, as well as packages such as Scikit-learn and SciPy.
Want to collaborate? Reach out below!
Thanks for your message! I will reach out to you right away.
*Please fill out all parts of the form.
*Please enter a valid email address.
There was a problem with the captcha. Please try again.
I'm a software developer who specializes in data collection and analysis, as well as data communication through data visualization.
I will help you dig in to get the most value from your data, and then effectively communicate these findings to the right audience.
Write me a note with some background on your project, and I look forward to getting in touch!