The Google Analytics Reporting API can seem a little complicated, but it is pretty straightforward once you get the hang of it.
What is the Google Analytics API?
If you have a website and use Google Analytics on it, you're probably aware of the types of things you can track through the dashboard.
Things like...
- How many users visited my website this week?
- What time of day do my users tend to visit the website?
- What was the bounce rate on various pages of my website?
- Where are my users located?
- Which browser/operating system/etc are my users using?
- How did users find my website? Through search engines, social media, etc.
Conveniently enough, you can access this data through the API and create different types of reports from it.
Maybe you want to build a custom dashboard of the analytics data, or you have another project you want to integrate Google Analytics into in some way.
In this post we will use Python to access the Google Analytics Reporting API V4.
If you don't have a Google Analytics account, you can create one at https://analytics.google.com.
If you want to skip all of the setup and just read about interacting with the API, feel free to skip to that section.
Google Analytics API Python client
We will use the Python client for the Google Analytics API.
The client supports Python versions 3.4-3.7, but is not tested for newer versions of Python, and Python 2 is deprecated.
In this post I will simply connect to the API to get reporting data for my own account.
Other use cases might be if you were building a web application and wanted to have your users connect to their Google Analytics accounts using Oauth2.
We will not be doing the Oauth2 dance in this post.
Install the Python client library
Create a new virtual environment for the project.
And install the Python client library into the virtual environment.
pip install --upgrade google-api-python-client
In a new file, import the modules we will be using from the client library.
from apiclient.discovery import build
from oauth2client.service_account import ServiceAccountCredentials
Connecting to the API
Now we are ready to connect to the API, and will do so with a Google developers service account.
First enable the Google Analytics Reporting API and create credentials.
You can do that here.
When you create a new private key, for the key type pick JSON.
The JSON file will be downloaded to your computer, and you will want to either take note of its file path, or move the file to the same directory where you will run your Python script.
Three things we need to connect to the API
- Scope - we will be requesting read-only access to the API.
- Location of the JSON key file that was downloaded earlier.
- The view ID from your Google Analytics Account.
SCOPES = ['https://www.googleapis.com/auth/analytics.readonly']
KEY_FILE_LOCATION = 'google_api_key.json'
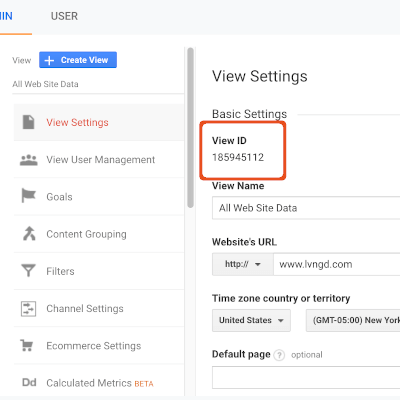
VIEW_ID = '185945112'
How to find the view ID
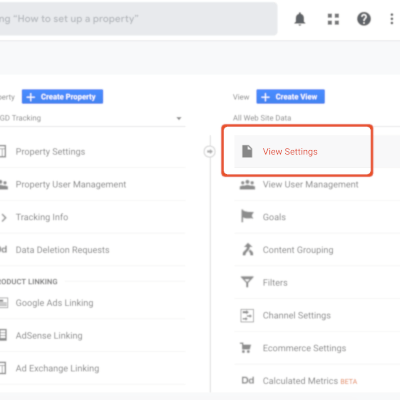
The view ID can be found in your Google Analytics account settings.
The Google Analytics hierarchy is Account -> Property -> View. Read more about this hierarchy in the docs.
In your Google Analytics account, identify the account and property that you are interested in, and then go to the settings within that property.
From there you can find the view settings.
Connecting to the API
First we need to create a credentials object with the JSON key file and the read-only scope.
credentials = ServiceAccountCredentials.from_json_keyfile_name(
            KEY_FILE_LOCATION, SCOPES)
Then initialize an analytics reporting object.
analytics = build('analyticsreporting', 'v4', credentials=credentials)
We will use this analytics object to interact with the API and request data.
Requesting Data: Reports
The Google Analytics API has two main entities that we will be concerned with to construct requests.
ReportRequest objects contain the specifications about the data you want to retrieve. The rest of the post is about constructing these report requests.- The
batchGet method packages these reports into an API request and accepts a maximum of five ReportRequest objects per request.
Let's look at a basic API request before getting into the details of all of this.
This query is for data related to the percent of sessions that are new users.
response = analytics.reports().batchGet(
    body={
        'reportRequests': [
            {
                'viewId': VIEW_ID,
                'dateRanges': [{'startDate': '7daysAgo', 'endDate': 'today'}],
                'metrics': [{'expression': 'ga:percentNewSessions'}]
                }]
                }
            ).execute()
And the report request for this data is constructed within the body dictionary.
The minimum requirements for a ReportRequest object
- A valid view ID.
- A date range for the data you want to retrieve. The date range in this request is also the default date range.
- Metrics - these are quantitative measurements, for example, number of users or number of sessions.
Here the metric we are requesting data for is ga:percentNewSessions.
The Google Analytics API reference has a great Dimensions and Metrics Explorer tool that you can use to explore the various options for metrics and dimensions.
A report request has to have at least one metric, but dimensions are optional.
API Response format
The response format looks similar to this for your reports.
{'reports':
  [{'columnHeader':
    {'metricHeader':
      {'metricHeaderEntries':
        [{'name': 'ga:percentNewSessions',                                                              ,
          'data': {'maximums': [{'values': ['77.64705882352942']}],
          'minimums': [{'values': ['77.64705882352942']}],
          'rowCount': 1,
          'rows':
            [{'metrics':
              [{'values': ['77.64705882352942']}]}],
          'totals':
            [{'values': ['77.64705882352942']}]}}]}
There is is a dictionary of reports, and you can iterate through each report - there is only one report in this example - and get the rows of data from each report returned.
for report in response.get('reports', []):
    column_header = report.get('columnHeader', {})
    dimension_headeres = report.get('dimensions', [])
    metric_headers = column_header.get('metricHeader', {}).get('metricHeaderEntries', [])
    #iterate through the rows
    for row in report.get('data', {}).get('rows', []:
        #do something with each row of data returned
Anatomy of a ReportRequest
In the rest of the post we will go through the field options of a report request.
Here's an outline of the options you have - remember that the viewId, dateRanges, and metrics are the minimum required fields, so the rest of these are optional and can be combined in different ways.
{
  'reportRequests':
  [
    {
      'viewId': VIEW_ID,
      'dateRanges': [],
      'metrics': [],
      'metricFilterClauses': [],
      'dimensions': [],
      'dimensionFilterClauses': [],
      'segments': [],
      'pivots': [],
      'orderBys': [],
      'cohortGroup': {'cohorts': []},
      'pageToken': string,
      'pageSize': number,
      'includeEmptyRows': boolean,
      'hideTotals': boolean,
      'hideValueRanges': boolean
    }
  ]
}
I mentioned that the view ID, date range, and metrics are the minimum you need for a request.
So now we will go more in-depth and talk about the various parts.
You can click on any of these to go straight to that section.
The segments section includes an example of filtering data with dimensionFilterClauses, and there is an example of ordering data with orderBys in the histogram buckets section.
Metrics
I'm assuming you, dear reader, have a basic familiarity with metrics related to web analytics - things like what bounce rate means.
If not, Google is your friend for learning more about those!
You can specify up to ten metrics in your report requests.
Each metric should be in its own dictionary.
"metrics": [
                {"expression": metric_one},
                {"expression": metric_two}
            ]
Metric Expressions
One interesting thing you can do in Google Analytics reports is create metric expressions.
Since metrics are quantitative measurements, you can combine them in various ways to create a custom metric.
For example if you wanted to look at the number of sessions per user.
response = analytics.reports().batchGet(
    body={
        'reportRequests': [
            {
                'viewId': VIEW_ID,
                'dateRanges': [{'startDate': '7daysAgo', 'endDate': 'today'}],
                'metrics': [{'expression': 'ga:sessions/ga:users'}]
                }]
                }
            ).execute()
You can combine the metrics right in the request.
'metrics': [{'expression': 'ga:sessions/ga:users'}]
In this case ga:sessions, the number of sessions, is divided by ga:users, the number of users.
Google provides a lot of common metrics already, so a sessions-per-user metric is already available as ga:sessionsPerUser, but it is just an example of how you could combine other metrics depending on your needs.
Dimensions
Along with metrics, you can look at dimensions which are other attributes of the analytics data such as the city where a user is located.
- Reports can have a total of seven dimensions.
Not all dimensions and metrics can be queried together, and the explorer tool I mentioned earlier will tell you which ones can and cannot be combined.
Like with metrics, each dimension should be in its own dictionary.
'dimensions': [{'name': dimension_one},{ 'name': 'dimension_two}]
Multiple Reports
The batchGet API method can accept a list of up to five ReportRequest objects.
Here I'm taking the first request we made earlier and adding another report to look at the number of sessions for each page ga:pagePath on my site in the time frame of 7 days ago to today.
response = analytics.reports().batchGet(
    body={
        'reportRequests': [
            #first report
            {
                'viewId': VIEW_ID,
                'dateRanges': [{'startDate': '7daysAgo', 'endDate': 'today'}],
                'metrics': [{'expression': 'ga:sessions'}],
                'dimensions': [{'name': 'ga:pagePath'},
                ]
                    },
            #second report
                {
                'viewId': VIEW_ID,
                'dateRanges': [{'startDate': '7daysAgo', 'endDate': 'today'}],
                'metrics': [{'expression': 'ga:sessions'}],
                'dimensions': [{'name': 'ga:medium'}]
                }
            ]
        }
    ).execute()
The response can be iterated through just as before, only this time there will be two reports in the response dictionary.
All ReportRequest objects in a single call to batchGet should have the same:
- date range(s)
- view ID
- segments
- sampling level
- cohort group
We will talk about segments and cohorts later in the post.
You can read about sampling levels in the docs here.
If you have millions of sessions in your Google Analytics data, for example, you will need to use sampling.
Multiple Date Ranges
You can have more than one date range in a report - notice the plural dateRanges.
It accepts a list of date ranges.
So we can just add more date ranges to that list, with each range represented as a dictionary with a start date and an end date.
response = analytics.reports().batchGet(
    body={
        'reportRequests': [
            {
                'viewId': VIEW_ID,
                'dateRanges': [{'startDate': '2020-01-01', 'endDate': '2020-01-07'}, {'startDate': '7daysAgo', 'endDate': 'today'}],
                'metrics': [{'expression': 'ga:percentNewSessions'}]
                }]
                }
            ).execute()
Here I've added a date range to the request we made earlier.
Note that when doing this, ga:percentNewSessions will be calculated for the dates in both ranges together, so there will only be one number and not a separate value calculated for each date range.
Segments
A segment is a subset of the data that you've filtered based on some dimension.
Up to 4 segments are allowed in a report, and they must be defined the same for all of the ReportRequest objects.
You can either create a dynamic segment on-the-fly in the query, or if you have a predefined segment in your Google Analytics account, you can indicate the segment ID in the query.
To interact programmatically with your account information for something like retrieving a stored segment ID, you would need to use the Google Analytics Management API.
Otherwise just go into your account and get the segment ID manually.
Example: Segment of users from New York
Say I wanted to look at a segment of users from a certain city, like New York.
Here I will create a dynamic segment that counts the number of sessions from users located in New York, with a date range of 7 days ago up until today.
response = analytics.reports().batchGet(
  body={
    'reportRequests':[
  {
    'viewId':VIEW_ID,
    'dimensions':[
    {
      'name': 'ga:segment'
    },
    {
      'name':'ga:city'
    }],
    'dateRanges':[
    {
      'startDate':'7daysAgo',
      'endDate':'today'
    }],
    'metrics':[
    {
      'expression':'ga:sessions',
      'alias':'sessions'
    }],
    'segments':[
    {
      'dynamicSegment':
      {
        'name': 'New York Users',
        'userSegment':
        {
          'segmentFilters':[
          {
            'simpleSegment':
            {
              'orFiltersForSegment':
              {
                'segmentFilterClauses': [
                {
                  'dimensionFilter':
                  {
                    'dimensionName':'ga:city',
                    'operator':'EXACT',
                    'expressions':['New York']
                  }
                }]
              }
            }
          }]
        }
      }
    }]
  }]
}).execute()
Notice I've added ga:segment to the list of dimensions.
I'm going to go through this segment filter from the inside out.
- We're using
dimensionFilter to filter the city dimension for an exact match of 'New York'.
- Segment Filter Clauses are the filters we've defined, and they are are combined with the logical OR operator.
- The
orFiltersForSegment dictionary contains the Segment Filter Clause lists that are combined with the logcal AND operator.
- Simple Segment. Here I only have one filter for the city name. You can also have a Sequence Segment with more than one filter in sequence.
- User Segment. There are User Segments and Session Segments, where User Segments filter the data on a user level and Session Segments filter the data on a session level.
- I gave the segment a name, 'New York Users'.
One thing to keep in mind is that not all metrics and dimensions can be used to create segments.
The Dimensions and Metrics explorer tool that I mentioned earlier has a box you can check to only show fields that are allowed in segments.
Read more about dimension filtering in the docs.
You can also filter metrics - read more in the docs.
If you have a segment saved in your account, you can just use the segment ID in the request and you're all set.
{
  "reportRequests":
  [
    {
      "viewId": VIEW_ID,
      "dimensions": [{"name": "ga:medium"}, {"name": "ga:segment"}],
      "metrics": [{"expression": "ga:users"}],
      "segments":  [{"segmentId": segment_id_from_your_account}]
    }
  ]
}
Note that you can use segmentId or dynamicSegment, but not both at the same time in a request.
Other resources for segments
Check out the Segment builder tool.
Also read the Segment docs for more.
Pivot tables
If you're familiar with pivot tables, where you might want to look at a couple of dimensions, like looking at sessions counts and which countries your traffic is coming from, and then pivoting that on some other dimension like the browser they are using.
Requests can have a maximum of two pivots.
response = analytics.reports().batchGet(body=
    {"reportRequests":[{"viewId": VIEW_ID,"dateRanges":[{
          "startDate": '7daysAgo',
          "endDate": 'today'
        }],"metrics":[{"expression": "ga:sessions"}],
        "dimensions": [{"name": "ga:country"}],
        "pivots":[
            {"dimensions":
                [{"name": "ga:browser"}],
                "maxGroupCount": 10,
                "startGroup": 0,
            "metrics":
                [{"expression": "ga:sessions"}]
                }]}]}
        ).execute()
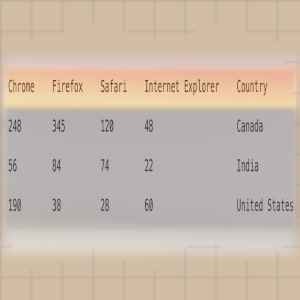
With this request, you end up with data that makes up a table similar to this (very simplified!) one.
Cohort Groups
Cohorts are groups of users that share a common characteristic in a specified date range.
There are certain dimensions and metrics that you can use for cohort reporting - find them in the docs here.
For the most part the dimensions and metrics available are related to the date the user first visited your site, or how they got to your site, through organic search, social media, through a campaign you launched, or something like that.
I could divide users into cohorts based on whether or not they found my site from a search engine, or were referred in some way, for example through social media.
response = analytics.reports().batchGet(body={
    'reportRequests': [
        {
            'viewId': VIEW_ID,
            'dimensions': [
                {'name': 'ga:cohort'},
                {'name': 'ga:acquisitionSource'}],
            'metrics': [
                {'expression': 'ga:cohortTotalUsers'},
                {'expression': 'ga:cohortPageviewsPerUser'}
            ],
            'cohortGroup': {
                'cohorts': [{
                    'name': 'cohort 1',
                    'type': 'FIRST_VISIT_DATE',
                    'dateRange': {
                        'startDate': '2020-01-01',
                        'endDate': 'yesterday'
                    }
                },
                            {
                                'name': 'cohort 2',
                                'type': 'FIRST_VISIT_DATE',
                                'dateRange': {
                                    'startDate': '2020-01-01',
                                    'end_date': 'yesterday'
                                }
                            }],
                'lifetimeValue': False
            }
        }]
}).execute()
Notice I've included the ga:cohort dimension, and my other dimension is the acquisition source, which would be either a search engine or another website that referred the user to my site.
The metrics I'm looking at are the total number of users, and the page views per user in a cohort.
- Currently the only cohort type available is
FIRST_VISIT_DATE.
- Cohort names must be unique.
- You can have up to 12 cohorts in a request.
- Cohort and non-cohort requests should not be in the same batchGet request.
Read more about cohort groups in the docs.
Histogram buckets
You can define your own histogram buckets for dimensions of the data that have integer values.
If you wanted to look at the session counts for each user in some date range, you could divide up the counts into histogram buckets.
response = analytics.reports().batchGet(
  body={
    'reportRequests':[
    {
    'dateRanges': [
        {
            'endDate': '2020-02-29',
            'startDate': '2015-01-01'
        }
    ],
    'metrics': [
        {
            'expression': 'ga:users'
        }
    ],
    'viewId': VIEW_ID,
    'dimensions':[
    {
      'name':'ga:sessionCount',
      'histogramBuckets':['1','10','100','200', '400']
    }],
    'orderBys':[
    {
      'fieldName':'ga:sessionCount',
      'orderType':'HISTOGRAM_BUCKET'
    }],
  }]
  }
).execute()
In the dimensions list and the dictionary for the ga:sessionCount dimension, we've added instructions to divide the data into histogram buckets, which is another list of how you want to divide up the data.
'histogramBuckets':['1','10','100','200', '400']
Ordering data
With the histogram buckets, we specified an orderBys to organize the data in the histogram buckets we've defined.
In other cases, you would order data either in ascending or descending order, by specifying the field name and the sort order.
'orderBys':
[
  {'fieldName': 'ga:sessionCount', 'sortOrder': 'DESCENDING'}
]
Other options for report requests
There are a few final options when constructing a report that are related to the report itself.
{
  'reportRequests':
  [
    {
      'viewId': VIEW_ID,
      'dateRanges': [{'startDate': '7daysAgo', 'endDate': 'today'}],
      'metrics': [{'expression': 'ga:sessions'}],
      ...
      'includeEmptyRows': boolean,
      'hideTotals': boolean,
      'hideValueRanges': boolean,
      'pageToken': string,
      'pageSize': number
    }
  ]
}
The includeEmptyRows field defaults to False, where the API will not return rows if all of the retrieved metrics are zero.
You can hide the totals for all metrics with the hideTotals field, which defaults to False.
If you set hideValueRanges to True, it will hide the minimum and maximum values for all of the matching rows. This defaults to False as well.
Pagination
If you need to paginate through the data, you would use the pageToken option.
When you initiate an API request, in the response there will be a nextPageToken parameter, and this will have the page token you can use to request the next page of data.
The pageSize option indicates the maximum number of returned rows and is used for pagination.
The default is 1000 rows, and there is a maximum of 100,000 rows no matter what you specify for the page size.
Thanks for reading!
So those are the basics of the Google Analytics Reporting API V4.
Read more about creating report requests in the docs.
Another resource you can use is the request composer tool which will help if you are in a bind trying to create the right request for the report you want.
If you have questions or comments, write to me in the box below, or reach out on Twitter @LVNGD!