You can find the code for this post here.
Side note: arc animation in D3
If you are interested in animating arc diagrams, I have a few examples on Observable that I will list below.
These examples aren't all animating arc diagrams exactly, but they use the same concepts, like .attrTween().
I'm assuming basic knowledge of D3.js and SVG for this, but feel free to read along even if you're new to D3.js!
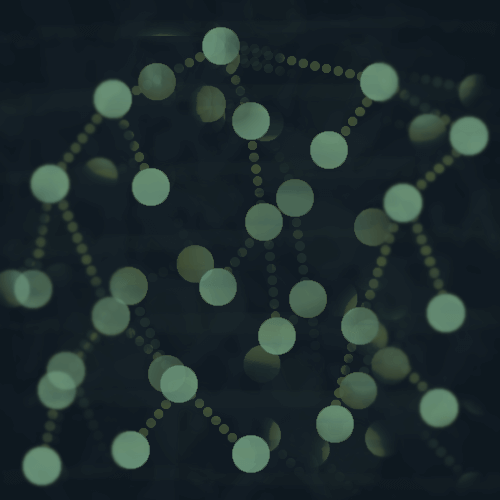
Arc diagrams in D3.js
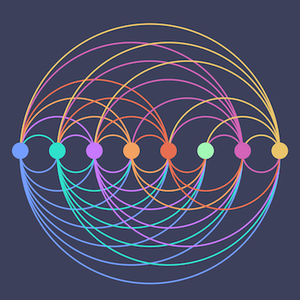
In this visualization there are nodes for each borough of NYC, as well as each of the three major airports in the area.
From this sample of the data you can see that each row has a pick-up name pu_name, a drop-off name do_name and then a count of the number of rides.
[
{"pu_name":"Bronx","do_name":"Bronx","count":8801},
{"pu_name":"Bronx","do_name":"Brooklyn","count":103},
{"pu_name":"Bronx","do_name":"JFK Airport","count":43},
{"pu_name":"Bronx","do_name":"LaGuardia Airport","count":64},
{"pu_name":"Bronx","do_name":"Manhattan","count":2177},
{"pu_name":"Bronx","do_name":"Newark Airport","count":2},
{"pu_name":"Bronx","do_name":"Queens","count":269},
{"pu_name":"Bronx","do_name":"Staten Island","count":1},
...
]
The links are the arcs that will be drawn between pickup and dropoff nodes, and they vary in thickness based on the count of rides from a pickup location to a dropoff location.
Two steps to building an arc diagram in D3.js
- First we will create an x-axis and place the nodes along it.
- Then draw the arcs between nodes.
The full code is here, and I'm mainly going to go over the important parts in this post.
Create an axis for the nodes
First get the node names from the data - I'm just extracting them from the do_name because all of the nodes are dropoff locations.
There are not as many records of pickups from Newark Airport, so if you only create this visualization with a small amount of data, Newark might not be in there as a pickup location.
var nodes = d3.map(data, function(d,i){return d.do_name;}).keys();
Then create the axis.
var x = d3.scalePoint()
    .range([0, width])
    .domain(nodes);
You can use d3.scalePoint() for discrete values, such as the names of boroughs and airports here, and they will be spaced evenly along the range of the axis.
Draw the circles
Here we are just adding circles for each node along the axis, using the list of nodes.
    var labels = svg.append("g");

    var node = labels
        .selectAll("nodes")
        .data(nodes)
        .enter()
        .append("circle")
          .attr("cx", function(d){return(x(d))})
          .attr("cy", (height/2)-120)
          .attr("r", 80)
          .attr("fill", circleBackground)
          .attr("stroke", function(d){return color[nodes.indexOf(d)];})
          .attr("stroke-width", 10)
          .attr("opacity", circleOpacity);
The circles have a background color and opacity set as well.
Circle labels
Then draw the labels over the circles, which are just the borough and airport names.
svg
    .selectAll("labels")
    .data(nodes)
    .enter()
    .append("text")
      .attr("x", function(d){return(x(d))})
      .attr("y", 510)
      .text(function(d){ var s = d.replace(' Airport','');return(s);})
      .attr("fill", function(d){return color[nodes.indexOf(d)]})
      .attr("stroke", function(d){return color[nodes.indexOf(d)]})
      .style("text-anchor", "middle")
      .style("font-weight", "bold")
      .style("font-family", fontFamily)
      .style("font-size", "1.65em");
I removed the words 'Airport' from the airport names to save space, and then added the airplane icons.
I might have a future post on drawing the airplanes - they are just SVG shapes that I placed on the circles.
Draw the arcs between nodes
Now for the fun part, or at least the complicated part.
An arc is a section of an ellipse or circle, so we have to take this into account when defining the path.
The arcs are just SVG paths between two nodes.
svg
    .selectAll('links')
    .data(data)
    .enter()
    .append('path')
    .attr('d', function (d) {
        var yCoord = (height/2)-100; //y coordinate where axis is positioned
        start = x(d.pu_name)    // x position of pickup node
        end = x(d.do_name)      // x position of dropoff node
        var arc =  ['M', start, yCoord,'A',(start - end)/2,(start - end)/2, 0, 0,0, end, yCoord].join(' ');
            return arc;
            })
            .style("fill", "none")
            .attr("stroke", function(d){return color[nodes.indexOf(d.pu_name)];})
            .attr("stroke-width", function(d){return lineScale(d.count);})
            .attr("opacity", arcOpacity);
A path is defined by the d attribute.
    .attr('d', function (d) {
        start = x(d.pu_name)    // x position of start node
        end = x(d.do_name)      // x position of end node
        var arc =  ['M', start, yCoord,'A',(start - end)/2, ',',(start - end)/2, 0, 0, ',',0, end, ',', yCoord].join(' ');
            return arc;
            })
First get the starting and ending x-coordinates for the pickup and dropoff nodes that will be connected by the arc.
Then we draw the path between them, which is an elliptical arc.
Take a look at the visualization and you can probably see how each arc makes up a section of an ellipse.
var arc = ['M', start, yCoord,'A',(start - end)/2, ',',(start - end)/2, 0, 0, ',',0, end, ',', yCoord].join(' ');
SVG paths are made up of commands, and each command takes certain parameters.
So the line above is just taking the list of commands and parameters and joining it together into a string.
An example might look like this:
M 1730 525 A 247.1428571428571 247.1428571428571 0 0 0 1235.7142857142858 525
Starting point of the arc
The first command, M, indicates a starting point to move the cursor to, and in this case it is the starting point coordinates for the pickup node.
Then the A command defines the arc with several parameters.
- x-radius of the ellipse
- y-radius of the ellipse
- x-axis rotation
- large-arc-flag
- sweep-flag
- coordinates of ending point
The x and y radii are both (start - end)/2, so the height of the arc is proportional to its width.
There is no rotation, so the x-axis rotation is zero.
The large-arc-flag is set to 0 or 1 and determines whether the arc should be greater or less than 180 degrees, so it determines the direction the arc will travel around the ellipse.
You can read more about arcs and the large-arc-flag in this article, but we don't need to worry about it for this visualization.
Sweep-flag
The sweep-flag also takes a value of 0 or 1 and determines whether the arc should begin moving at negative or positive angles.
In this visualization, if we set the sweep-flag to 1, the arc directions will be reversed.
Since I set the sweep-flag to zero, you can see that arcs that go from left to right are on the bottom, and arcs from right to left are on top.
If you wanted all of the arcs to be on top, you could check if the starting point x-coordinate is smaller than the ending point x-coordinate, and if it is, then set the sweep-flag to 1.
Define the arc ending
The last two values in the path definition are the x and y coordinates for where the arc should end, which are the dropoff node's x-coordinate, and the y-coordinate.
Notice the path definition starts with the M command and pickup node coordinates, and then the A command ends with the dropoff node coordinates.
Arc thickness
You might have noticed that the arcs have varying levels of thickness, and this depends on the number of rides between the pickup and dropoff nodes.
The arc from Manhattan to Brooklyn is much thicker than the arc from Staten Island to the Bronx, because there weren't many rides between SI and the Bronx.
To set the thickness, we are going to use a D3.js linear scale.
First get the maximum count value in the data.
var maxCount = d3.max(data.map((d) => {return d.count}));
Then create the scale.
var lineScale = d3.scaleLinear()
    .domain([0,maxCount])
    .range([2,700]);
The domain, or input values, is a range from zero to maxCount, and then I set the range, or output values, to a range of 2 to 700.
So the count value for each arc will be scaled to some thickness value between 2 and 700.
In the code above to add the arcs, the stroke-width was set to the scaled value.
.attr("stroke-width", function(d){return lineScale(d.count);})
Thanks for reading!
If you have questions or comments, feel free to write them below or reach out to me on Twitter @LVNGD or Instagram @lvngd_dataviz.