Feb. 16, 2020
Data cleaning with Python + Pandas: An Introduction
You've likely heard that data scientists spend around 80% of their time cleaning data.
It's important to clean up your data because dirty data will lead to dirty analysis and dirty predictions.
The dirty data could be used to make predictions that end up costing a company or an individual a lot of money, and might cost some people their jobs.

A total nightmare that can be averted by investing effort in making sure the data you're working with is clean and high quality.
Today we will do that with Pandas, a Python library for data manipulation and analysis.
If you've worked with Excel or really any spreadsheet tool, it's similar to working with a Pandas DataFrame, except that you're writing Python code to do the calculations and manipulations.
That said, you don't need to be a Python expert to work with Pandas!
In this post
How does data get dirty?
- Missing data
- Inconsistent data
- Duplicate data
To name a few things that can go wrong.
There is an endless list of ways that data can end up very messy.
Sometimes there are insufficient validation checks when the data is entered in the first place.
If you have form fields with users entering data in any format they want with no guidelines or form validation checks in place to enforce conforming to a certain format, then users will input however they see fit.
There could be an input field for the state(U.S.) and you have some data that is the 2-character abbreviation, NY and then others have New York, then there are potential misspellings and typos...
Data can also become corrupted during transmission or in storage.
Data cleaning with Python + Pandas
We'll use Pandas to examine and clean the Building Violations dataset from the NYC Department of Buildings(DOB) that is available on NYC Open Data.
Find the dataset here.
For this demonstration I'm working with a subset of the data - 10,000 records that I retrieved from the API.
I have another post on accessing NYC Open Data from the API and getting an API key here.
Setup
- Create a virtual environment for this project.
- Install Python-requests and Pandas.
- Retrieve 10,000 records of violation data in 2019 from the NYC Open Data API.
- Create a Pandas DataFrame with the data that we will use in the rest of the post.
mkvirtualenv cleandata

pip install requests
pip install pandas
Import both of these, along with NumPy, which is installed along with Pandas, and we will also be using.
import requests
import pandas as pd
import numpy as np

NYC_OPEN_DATA_API_KEY='xxxxxxxxx'

#DOB violations endpoint
endpoint = 'https://data.cityofnewyork.us/resource/3h2n-5cm9.json?$where=starts_with(issue_date,"2019")&$limit=10000'

headers={'X-App-Token': NYC_OPEN_DATA_API_KEY}
result = requests.get(endpoint, headers=headers)
df = pd.DataFrame(result.json())
Note: it's a good idea to keep your API keys outside of your scripts. Use an environment variable or some other tool to manage sensitive information.
So I grabbed the data from the API and created a Pandas DataFrame df with it, which we will work with in the rest of the post.
Profile the data
Let's see what we're dealing with here.
In [1]: df.shape
Out[1]: (10000, 18)
There are 10,000 records in this dataset.
Check out the first few rows

We can look at the first few rows by calling head().
In [3]: df.head()
Out[3]:
       bin  block boro         ...         violation_number                                     violation_type violation_type_code
0  3059563  02136    3         ...                    00339  JVCAT5-RESIDENTIAL ELEVATOR PERIODIC INSPECTIO...              JVCAT5
1  3215627  07777    3         ...                    00951                    AEUHAZ1-FAIL TO CERTIFY CLASS 1             AEUHAZ1
2  3137310  05631    3         ...                 NRF01042                                  LL2604S-SPRINKLER             LL2604S
3  2003035  02504    2         ...                    00162                    AEUHAZ1-FAIL TO CERTIFY CLASS 1             AEUHAZ1
4  1001389  00113    1         ...                    00284  ACC1-(OTHER BLDGS TYPES) - ELEVATOR AFFIRMATIO...                ACC1

[5 rows x 18 columns]
There are 18 columns in this dataset.
Column / feature names

Let's look at the column names.
In [4]: df.columns
Out[4]:
Index(['bin', 'block', 'boro', 'description', 'device_number',
       'disposition_comments', 'disposition_date', 'ecb_number',
       'house_number', 'isn_dob_bis_viol', 'issue_date', 'lot', 'number',
       'street', 'violation_category', 'violation_number', 'violation_type',
       'violation_type_code'],
      dtype='object')
The bin column stands for building identification number, and is a unique identifier the DOB uses for buildings in NYC.
Missing / Null values
Call isnull() and sum() to get a count of how many null values there are in each column.
In [5]: df.isnull().sum()
Out[5]:
bin                        0
block                      2
boro                       0
description             2446
device_number           3772
disposition_comments    7349
disposition_date        7358
ecb_number              8093
house_number               0
isn_dob_bis_viol           0
issue_date                 0
lot                        2
number                     0
street                     0
violation_category         0
violation_number           0
violation_type             0
violation_type_code        0
dtype: int64
We will talk more about missing values later in the post.
Dropping irrelevant columns

I'm mainly interested in looking at the types of violations each building received and whether they have been closed or are still open, so I'm going to drop some columns right from the start that are just more information about the building location and administrative data for the DOB.
In [6]: columns_to_delete = ['block', 'boro','house_number','lot','street','violation_number', 'device_number', 'disposition_comments', 'isn_dob_bis_viol', 'disposition_date','ecb_number','description']
In [7]: df.drop(columns_to_delete, inplace=True, axis=1)
Here I made a list of the columns I wanted to delete and then passed it to df.drop().
A lot of Pandas functions can be run in-place.
In Pandas, axis 0 represents rows and axis 1 represents columns, so I've indicated axis=1 because I'm deleting columns.
Great, now let's see which columns are still in the dataframe.
In [8]: df.columns
Out[8]:
Index(['bin', 'issue_date', 'number', 'violation_category', 'violation_type',
       'violation_type_code'],
      dtype='object')
Okay we've looked over the data and trimmed it down a bit, now it's time to look at each column.
Descriptive statistics

You can call describe() to get a summary of each column in the dataframe.
In [9]: df.describe()
Out[9]:
            bin           issue_date                number        violation_category violation_type violation_type_code
count     10000                10000                 10000                     10000          10000               10000
unique     8545                  327                  9996                         9             27                  27
top     3397861  2019-11-08 00:00:00  V*030619AEUHAZ100139  V-DOB VIOLATION - ACTIVE     E-ELEVATOR                   E
freq          8                 1554                     2                      7330           2214                2214
first       NaN  2019-01-01 00:00:00                   NaN                       NaN            NaN                 NaN
last        NaN  2019-12-31 00:00:00                   NaN                       NaN            NaN                 NaN
For numeric data you would also get the mean, median, standard deviation, and percentiles as well.
The top value is the most common value found in the column, so for example here the building with ID number 3397861 appears to have the most entries in this dataset.
Read more about describe() in the docs.
Data quality
The next several sections will cover data quality checks.
Read more about data quality on Wikipedia.
Datatypes
It's important that the data values in each column are the correct datatype that you are expecting them to be.
For example, if the data should be in numeric format but you find string data in the column.
Later when you go to do numeric calculations you might get surprising results when you think you're adding two numbers, but they are strings, so they get concatenated.

The attribute dtypes will show you the datatypes for each column in the dataframe.
In [10]: df.dtypes
Out[10]:
bin                    object
issue_date             object
number                 object
violation_category     object
violation_type         object
violation_type_code    object
dtype: object
The Pandas object datatype can be mixed types, with string and numeric data, but Pandas will treat it as a string.
With this dataset, my main concern is with the issue_date column.
In [11]: df['issue_date'].head()
Out[11]:
0    20190520
1    20190516
2    20190903
3    20190904
4    20190906
Name: issue_date, dtype: object
The dates are strings in YYYYMMDD format.
I want to convert it to a Python datetime, and Pandas has an easy way of doing that with the to_datetime() method - read the docs for more.
In [12]: df['issue_date'] = pd.to_datetime(df['issue_date'])
In [13]: df['issue_date'].head()
Out[13]:
0   2019-05-20
1   2019-05-16
2   2019-09-03
3   2019-09-04
4   2019-09-06
Name: issue_date, dtype: datetime64[ns]
Pandas is smart and can usually figure out the date format without you having to specify it.
I'm not doing any numeric calculations on the other columns, so I am going to leave them as object types.
I could convert the bin column to integer format, but I'm not doing any numeric calculations with it, and in the API docs for the dataset it is a text field.
The rest are mostly alphanumeric or just string text.
Data constraints

Make sure any constraints on the data are respected.
There are many types of constraints that you might need to follow with a given dataset, and when cleaning it you will want to make sure that you test any of them that are relevant.
- date ranges
- number ranges - minimum or maximum values for a column
- non-null constraints - if a value should not be null but is
- unique constraints - two or more column values must be unique together in the data
- foreign key constraints
- patterns - if the data should be in the format of an email address or phone number, it can be validated with regular expressions for these patterns
- if you're working with geographic data like longitude and latitude, you could set boundaries for acceptable latitude and longitude coordinates if you know where your data points should be located, and if points fall far outside of that boundary you know you need to examine it further
...and many more.
Testing dates in the issue_date column
The building violations data should all have dates in 2019.
I've converted the column to the Python datetime format, so I could test that the date range is correct by creating a boolean mask - an array of True or False values for each item in the column - and then making sure that all rows that return True add up to the number of rows I expect to have.
In [14]: mask = (df['issue_date'] > '2018-12-31') & (df['issue_date'] <= '2019-12-31')
In [15]: df.loc[mask].shape
Out[15]: (10000, 18)
All 10000 rows are in 2019, so it passed the test!
Uniformity

Values in a dataset should be the correct datatype, and they should also be uniform in units as well.
If some samples in a column are in miles-per-hour units while others are in kilometers-per-hour, then any analysis will be based on partially incorrect data.
You will want to make sure data is converted into the same units.
Data accuracy
Checking for data accuracy can be closely tied with the constraints we talked about.
A user might enter a U.S. phone number as '000-000-0000', which is the correct format and would pass any kind of regular expression, but it might not be a real phone number.
It can be difficult to check for data accuracy if you do not have a reliable resource to compare your data to.
There are APIs you could use to validate a U.S. postal address, for example.
Consistency
Data should be consistent across data sources.
If you have data about a retail product, and the price is different in two different tables, it might be a problem.
Conflicting values for the same entity should be looked into.
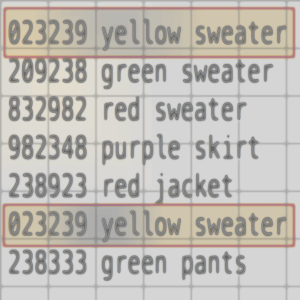
Duplicates
If a user accidentally submits a form twice, or you scrape a website twice without realizing it, or in plenty of other scenarios, you could end up with duplicate data.
Pandas drop_duplicates()
You could have entire rows that are duplicates, or just duplicate values in a column when the column should be unique.
The drop_duplicates() function in Pandas can be used in both of these cases.
Either the whole row can be a duplicate, or you can specify columns to check for duplicates with the subset parameter, which take a list of column names.
The keep parameter designates whether or not to keep any of the duplicates. The default is first so it would keep the first duplicate and drop the rest of them. Last will drop all duplicates except for the last occurrence. False will drop ALL of them.
df.drop_duplicates(inplace=True)
There is also the option to run it in-place.
Read more in the docs.
Missing values
Let's look again at the summary of null values in the dataset, only now we have fewer columns.
In [16]: df.isnull().sum()
Out[16]:
bin                    0
issue_date             0
number                 0
violation_category     0
violation_type         0
violation_type_code    0
dtype: int64
No missing values here.
Pandas recognizes a few things as missing values.
- Empty cells
- “NA”
- if the data is the wrong type for the column - string data in a numeric column, for example
What to do with missing values?
This could be a separate post, so I will just summarize.
First, try to figure out why the data is missing
With the building violations data, it seems reasonable to think that there should always be an issue_date for a violation, so if it were missing I would think there had likely been a value for it, but it didn't get recorded properly, or something like that.
On the other hand, there are other columns like disposition_comments(which is one of the columns I dropped earlier, but I'm just using it as an example) where maybe there was no comment entered, or it hasn't been entered yet, or comments are optional. So it could reasonably have a null value.
Read the documentation for your dataset to try to figure out the reason for missing data.
Delete or replace
When a dataset has missing or null values, it's important to decide what to do about them in the context of your project.
There are two basic options.
- delete rows or columns with missing values
- replace missing values
Delete
You can delete missing/null values in Pandas with dropna().
Columns
If you wanted to drop any column with missing values.
df.dropna(inplace=True,axis=1)
Or drop all columns that have a certain number of missing values.
You would pick a threshold and use the parameter thresh - the threshold is the number of non-null values you want the column to have.
df.dropna(thresh=int(df.shape[0] * .9), axis=1)
This would drop any column with less than 90% non-NA values.
Rows
The other option is to delete rows.
You could choose to delete any rows that have a missing value in ANY column.
Or you could delete rows that have a missing value in a subset of columns.
If I want to analyze the violations on a per-building basis, I might just delete rows that do not have a building identification number.
df.dropna(subset=['bin'],inplace=True)
The subset parameter allows you to specify a list of columns. docs
Replacing values
Pandas fillna()
Call fillna() on the DataFrame to fill in missing values.
If you wanted to fill in every missing value with a zero.
Or missing values can also be filled in by propagating the value that comes before or after it in the same column. docs
Propagating values backward.
df.fillna(method='bfill')
Propagating value forward.
df.fillna(method='ffill')
There are many ways to determine what to replace missing data with.
- median
- mean
- fixed value
- regression to predict correct value
- stochastic regression
- hot-deck imputation - randomly pick another row that has similar values on other variables and use its value
Cleaning data with Pandas apply()
Next let's clean up the violation_category column.
In [9]: df['violation_category'].unique()
Out[9]:
array(['V*-DOB VIOLATION - Resolved',
       'VW*-VIOLATION - WORK W/O PERMIT DISMISSED',
       'V*-DOB VIOLATION - DISMISSED', 'V-DOB VIOLATION - ACTIVE',
       'VP*-VIOLATION UNSERVED ECB- DISMISSED',
       'VW-VIOLATION WORK WITHOUT PERMIT - ACTIVE',
       'VPW*-VIOLATION UNSERVED ECB-WORK WITHOUT PERMIT-DISMISSED',
       'VH-VIOLATION HAZARDOUS - ACTIVE',
       'VH*-VIOLATION HAZARDOUS DISMISSED', nan,
       'VP-VIOLATION UNSERVED ECB-ACTIVE', 'V%-UB VIOLATION',
       'VPW-VIOLATION UNSERVED ECB-WORK WITHOUT PERMIT-ACTIVE'],
      dtype=object)
These categories come from a table found here.
The most informative part of these strings is the violation code, which is the first part of the string, before the '-': VW*,V*, V, etc.
If you look at the linked table, the part after the code is just a string of what the code means. The VW code is for work without a permit violations that are active.
Take a look at these two violation categories.
'V*-DOB VIOLATION - Resolved',
'V*-DOB VIOLATION - DISMISSED'
One says 'Resolved' and the other 'DISMISSED', but they have the same violation code V*.
This is an example of where it looks like there was a lack of validation when the data was entered.
According to the linked table, the code V* means the violation was Dismissed, so someone probably just wrote in 'Resolved' because there was no standard way of inputting the data.
It makes it look like there are more classes of violation categories than there are, but these two are really representing the same class of DOB violations that have been dismissed.
Another example of non-standardized formats is that the word 'without' is written differently in a couple of these.
'VW*-VIOLATION - WORK W/O PERMIT DISMISSED',
'VW-VIOLATION WORK WITHOUT PERMIT - ACTIVE'
These two represent different classes - VW* and VW, but I just take this sort of thing as a sign to examine the data a bit more closely.
I'm going to clean this up by making a dictionary dob_violation_codes of the codes with the violation category string data from the link above, and extract the violation code from each entry in the column and replace it with my string.
This will standardize the values in the column.
dob_violation_codes = {
    'B':'Boiler',
    'V': 'DOB Violation',
    'VP': 'Violation Unserved ECB-Active',
    'VP*': 'Violation Unserved ECB-Dismissed',
    'BDM': 'Boiler',
    'V*': 'DOB Violation Dismissed',
    'BMD': 'Boiler',
    ...
    'UB%': 'Precept issued for Unsafe Buildings Violation'
}
You can find the whole dictionary in this gist.
def replace_value(row):
    violation_cat = row['violation_category']
    if violation_cat:
        code_index = violation_cat.index('-')
        code = violation_cat[:code_index]
        try:
            violation_description = dob_violation_codes[code]
            violation_code_desc = "{}-{}".format(code,violation_description)
            return violation_code_desc
        except KeyError:
            pass
    return row['violation_category']
This function replaces the value in df['violation_category'] by extracting the violation code substring and finding the description in the dictionary.
If the code isn't found in the dictionary, it just returns whatever the original value was.
Now call df.apply() and pass it the replace_value function.
In [10]: df['violation_category'] = df.apply(replace_value,axis=1)
The default is axis=0 for columns, but we want to apply this function over each row.
Now look at the unique values in this column.
In [11]: df['violation_category'].unique()
Out[11]:
array(['V-DOB Violation', 'V*-DOB Violation Dismissed',
       'VP-Violation Unserved ECB-Active',
       'VP*-Violation Unserved ECB-Dismissed',
       'VPW-Violation Pending - Work Without a Permit',
       'VPW*-Violation Pending - Work Without a Permit Dismissed',
       'V%-Precept issued for Unsafe Buildings Violation',
       'VW-Violation - Work Without a Permit'], dtype=object)
It looks neater, and we have one category for each category code.
I hope this made sense - let me know if there are any questions!
Cleaning text data with NumPy where()
Next let's look at the violation_type column.
In [12]: df['violation_type'].head(10)
Out[12]:
0                                           E-ELEVATOR
1                                       C-CONSTRUCTION
2                                           E-ELEVATOR
3                                           E-ELEVATOR
4                    LL1081-LOCAL LAW 10/81 - ELEVATOR
5                                           E-ELEVATOR
6                     LL6291-LOCAL LAW 62/91 - BOILERS
7    ACC1-(OTHER BLDGS TYPES) - ELEVATOR AFFIRMATIO...
8                                           E-ELEVATOR
9                                           E-ELEVATOR
Name: violation_type, dtype: object
Call unique() on the violation_type column to see the unique values.
In [13]: df['violation_type'].unique()
Out[13]:
array(['E-ELEVATOR', 'C-CONSTRUCTION',
       'LL1081-LOCAL LAW 10/81 - ELEVATOR',
       'LL6291-LOCAL LAW 62/91 - BOILERS',
       'ACC1-(OTHER BLDGS TYPES) - ELEVATOR AFFIRMATION OF CORRECTION',
       'LBLVIO-LOW PRESSURE BOILER', 'AEUHAZ1-FAIL TO CERTIFY CLASS 1',
       'EVCAT1-ELEVATOR ANNUAL INSPECTION / TEST',
       'FISPNRF-NO REPORT AND / OR LATE FILING (FACADE)',
       'JVCAT5-RESIDENTIAL ELEVATOR PERIODIC INSPECTION/TEST',
       'VCAT1-ELEVATOR ANNUAL INSPECTION / TEST',
       'FISP-FACADE SAFETY PROGRAM', 'HBLVIO-HIGH PRESSURE BOILER',
       'LL2604S-SPRINKLER', 'LANDMK-LANDMARK', 'UB-UNSAFE BUILDINGS',
       'PA-PUBLIC ASSEMBLY', 'B-BOILER', 'LANDMRK-LANDMARK',
       'EVCAT5-NON-RESIDENTIAL ELEVATOR PERIODIC INSPECTION/TEST',
       'RWNRF-RETAINING WALL', 'LL1198-LOCAL LAW 11/98 - FACADE',
       'ES-ELECTRIC SIGNS', 'LL1080-LOCAL LAW 10/80 - FACADE',
       'P-PLUMBING', 'BENCH-FAILURE TO BENCHMARK',
       'LL11/98-LOCAL LAW 11/98 - FACADE',
       'L1198-LOCAL LAW 11/98 - FACADE', 'EARCX-FAILURE TO SUBMIT EER',
       'JVIOS-PRIVATE RESIDENTIAL ELEVATOR', 'CMQ-MARQUEE',
       'LL10/80-LOCAL LAW 10/80 - FACADE', 'LL5-LOCAL LAW 5/73',
       'IMEGNCY-IMMEDIATE EMERGENCY', 'LL2604E-EMERGENCY POWER',
       'Z-ZONING', 'EGNCY-EMERGENCY',
       'HVIOS-NYCHA ELEV ANNUAL INSPECTION/TEST',
       'ACH1-(NYCHA) - ELEVATOR AFFIRMATION OF CORRECTION',
       'ACJ1-(PRIVATE RESIDENCE) - ELEVATOR AFFIRMATION OF CORRECTION',
       'CS-SITE SAFETY', 'LL10/81-LOCAL LAW 10/81 - ELEVATOR',
       'LL2604-PHOTOLUMINESCENT', 'A-SEU', 'CLOS-PADLOCK',
       'LL16-LOCAL LAW 16/84 - ELEVATOR',
       'HVCAT5-NYCHA ELEVATOR PERIODIC INSPECTION/TEST'], dtype=object)
It's not clear exactly what some of these are, but many of them are related to elevators, boilers, construction violations, plumbing and that sort of thing.
Let's pretend that I just want to look at the most common types of violations in general.
We can look at the value counts for each.
In [27]: df['violation_type'].value_counts()
Out[27]:
E-ELEVATOR                                                       3202
LL6291-LOCAL LAW 62/91 - BOILERS                                 2748
LBLVIO-LOW PRESSURE BOILER                                        832
C-CONSTRUCTION                                                    819
AEUHAZ1-FAIL TO CERTIFY CLASS 1                                   559
LL1081-LOCAL LAW 10/81 - ELEVATOR                                 374
ACC1-(OTHER BLDGS TYPES) - ELEVATOR AFFIRMATION OF CORRECTION     305
EVCAT1-ELEVATOR ANNUAL INSPECTION / TEST                          235
BENCH-FAILURE TO BENCHMARK                                        120
LANDMK-LANDMARK                                                   105
UB-UNSAFE BUILDINGS                                                68
P-PLUMBING                                                         56
ES-ELECTRIC SIGNS                                                  51
FISPNRF-NO REPORT AND / OR LATE FILING (FACADE)                    47
EVCAT5-NON-RESIDENTIAL ELEVATOR PERIODIC INSPECTION/TEST           40
Z-ZONING                                                           33
EARCX-FAILURE TO SUBMIT EER                                        32
JVIOS-PRIVATE RESIDENTIAL ELEVATOR                                 32
B-BOILER                                                           31
L1198-LOCAL LAW 11/98 - FACADE                                     31
LL1198-LOCAL LAW 11/98 - FACADE                                    28
VCAT1-ELEVATOR ANNUAL INSPECTION / TEST                            27
IMEGNCY-IMMEDIATE EMERGENCY                                        24
CMQ-MARQUEE                                                        23
EGNCY-EMERGENCY                                                    22
LL11/98-LOCAL LAW 11/98 - FACADE                                   20
LANDMRK-LANDMARK                                                   18
FISP-FACADE SAFETY PROGRAM                                         16
LL1080-LOCAL LAW 10/80 - FACADE                                    14
LL10/80-LOCAL LAW 10/80 - FACADE                                   11
HBLVIO-HIGH PRESSURE BOILER                                        10
PA-PUBLIC ASSEMBLY                                                  9
ACH1-(NYCHA) - ELEVATOR AFFIRMATION OF CORRECTION                   9
RWNRF-RETAINING WALL                                                9
LL2604S-SPRINKLER                                                   6
LL2604E-EMERGENCY POWER                                             5
JVCAT5-RESIDENTIAL ELEVATOR PERIODIC INSPECTION/TEST                5
LL5-LOCAL LAW 5/73                                                  4
CS-SITE SAFETY                                                      4
HVIOS-NYCHA ELEV ANNUAL INSPECTION/TEST                             3
ACJ1-(PRIVATE RESIDENCE) - ELEVATOR AFFIRMATION OF CORRECTION       3
LL10/81-LOCAL LAW 10/81 - ELEVATOR                                  2
LL2604-PHOTOLUMINESCENT                                             2
LL16-LOCAL LAW 16/84 - ELEVATOR                                     2
CLOS-PADLOCK                                                        2
A-SEU                                                               1
HVCAT5-NYCHA ELEVATOR PERIODIC INSPECTION/TEST                      1
Name: violation_type, dtype: int64
Most of the violations have to do with elevators and boilers.
I'm mainly interested in looking at the general types of violations, so here I will relabel any elevator-related violation as 'ELEVATOR', boiler violations as 'BOILER' to make it cleaner.
That can be done with the where() function from NumPy. docs
The format is np.where(condition[, x, y]).
It takes a boolean array, and then if an item in the array is True, yield x, else yield y.
elevators = df['violation_type'].str.contains('ELEVATOR')
boilers = df['violation_type'].str.contains('BOILER')

df['violation_type'] = np.where(elevators,'ELEVATOR', np.where(boilers, 'BOILER', df['violation_type'])
Calling str.contains(substring) on a column returns a boolean mask of whether the row contains the substring.
You can also nest the np.where() calls, so in this case I nested the search for 'BOILER' and then if neither 'ELEVATOR' nor 'BOILER' is found, just return the contents of df['violation_type'].
Look at the value counts now.
In [8]: df['violation_type'].value_counts()
Out[8]:
ELEVATOR                                           4412
AEUHAZ1-FAIL TO CERTIFY CLASS 1                    1856
BOILER                                             1550
BENCH-FAILURE TO BENCHMARK                          993
C-CONSTRUCTION                                      394
FISPNRF-NO REPORT AND / OR LATE FILING (FACADE)     179
RWNRF-RETAINING WALL                                138
LL2604S-SPRINKLER                                   107
EARCX-FAILURE TO SUBMIT EER                         100
FISP-FACADE SAFETY PROGRAM                           73
P-PLUMBING                                           72
IMEGNCY-IMMEDIATE EMERGENCY                          40
LANDMK-LANDMARK                                      35
UB-UNSAFE BUILDINGS                                  19
HVIOS-NYCHA ELEV ANNUAL INSPECTION/TEST              14
EGNCY-EMERGENCY                                      10
Z-ZONING                                              4
CLOS-PADLOCK                                          3
CS-SITE SAFETY                                        1
Name: violation_type, dtype: int64
To further clean this up, I would want to research the other violation types like 'AEUHAZ1-FAIL TO CERTIFY CLASS 1' - it's not clear what that is.
Sometimes you have to dig for more information about a dataset.
I will leave it up to the reader to look at other columns and see how you might clean them up with the NumPy where() or Pandas apply() functions.
Normalization
You might not often need to normalize your data, and only would need to do that if you want to do statistical analysis that depends on the data being normally distributed, like t-tests, ANOVA, linear regression, etc.
Text normalization
If you're doing Natural Language Processing you might need to normalize your text as part of pre-processing to make it more uniform.

It could involve a variety of techniques.
- tokenization
- removing whitespace
- removing punctuation
- removing any non-alphanumeric characters
- stemming
- lemmatization
- remove stop words
- in English you might convert British <-> American English.
Thanks for reading!
Pandas is a very useful tool for data cleaning and manipulation in general, and is great for anyone to have in their data toolbox.
One book that is a great reference for Pandas is Python for Data Analysis. It's written by Wes McKinney, who is one of the main authors of Pandas.
And of course, let me know if you have any questions or comments! Write them below or reach out to me on Twitter @LVNGD.