April 12, 2020
Classification vs. Clustering in Machine Learning
There are two main types of learning in machine learning: supervised and unsupervised.
What's the difference?
To illustrate, we'll look at classification and clustering in this post, which are two common forms of supervised and unsupervised learning.
Classification
Classification algorithms attempt to map input data samples to a category or class.
Examples of classification
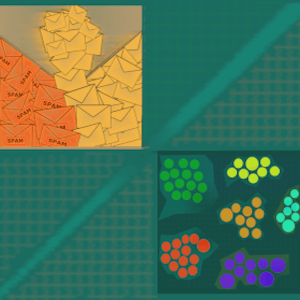
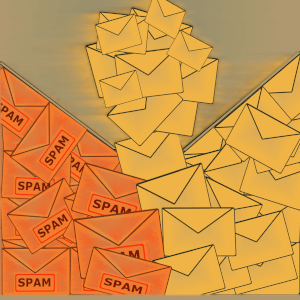
- Spam detection - whether or not an email should be sent to the spam folder.
- Lending agencies use classifiers to predict whether or not someone is likely to default on a loan.
- Fraud detection.
- Sentiment analysis of Tweets to determine if the Tweet has a negative, positive, or neutral sentiment or tone.
- Medical diagnostics - predicting whether a patient has some ailment based on symptoms and other characteristics about them.
Supervised learning
With classification, you are usually training a model using using supervised learning techniques.
This means you start with a labeled dataset and the classification algorithm attempts to learn from your training examples so that it can make predictions on future unknown samples.
The labels supervise and guide the learning process.
Logistic regression
Logistic regression is a common algorithm used in classification problems.
Scikit-learn has an implementation of Logistic regression.
Binary logistic regression is where there are two classes, the positive (1) and negative (0) class.
For example, anything related to detection, such as fraud detection or spam detection might use a binary classifier to either say that yes, it is spam or yes, fraud occurred, or no, it is not spam or fraud.
After training the model there will be a decision boundary where, if the data sample falls above that boundary, then it falls into one class, and if it is below, it falls into the other.
For a really simple visualization, if we had a dataset with two features x and y, we can plot the points on a 2-dimensional grid with feature x on the x-axis and feature y on the y-axis.
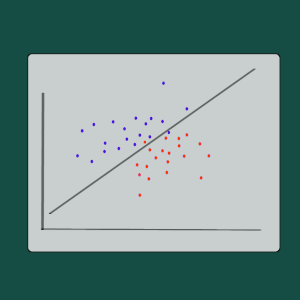
The two classes are represented by coloring the points red or purple.
The line through the points is the decision boundary which separates the classes.
The model predicts the probability that a data point belong to a certain class.
The predictions aren't always perfect, so the decision boundary line does not always perfectly split up the data.
In that case you can go back and iterate and try to improve the model with feature engineering or other techniques.
The decision boundary line also isn't always linear.
When there are more than two classes, it is multinomial logistic regression, also known as softmax regression.
The Twitter sentiment example has three classes of positive, negative or neutral.
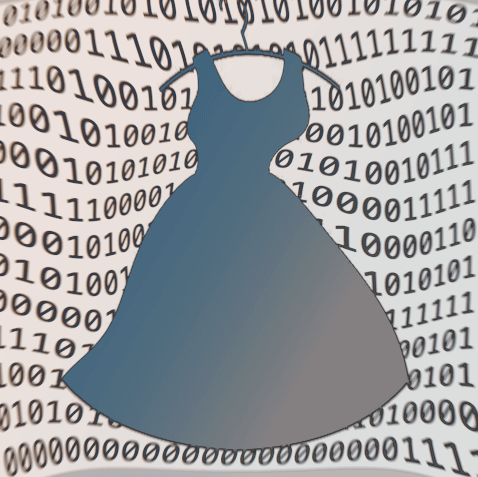
I built a classifier to determine whether or not text articles - blog posts and such - were about fashion or not. I wrote about that in this post.
The dataset is comprised of text data from articles and blog posts, along with labels of which class each training sample belongs to.
Labels
- yes, the article is about fashion
- no, the article is not about fashion
The classification algorithm goes through the samples and learns from the features extracted from the text data, then it makes a prediction of which class the sample belongs to, and then looks at the label for the correct answer.
The trained model is a function with weights or coefficients for each feature of the data.
As the training process progresses, the algorithm predicts the output for a training data sample, and then looks at the label to see if it is correct, and if it is not correct, it adjusts the weights to correct itself.
How to use the classifier
Once the model is trained, it can take as input a previously unseen text document, and will output the predicted class of whether or not it is about fashion.
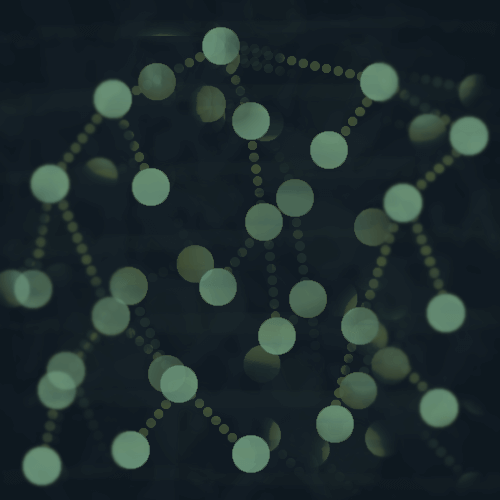
Clustering
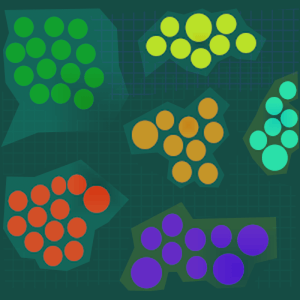
Clustering algorithms usually use unsupervised learning techniques to learn inherent patterns in the data.
The training data is unlabeled, so the model learns based on finding patterns in the features of the data without having the 'right' answers (labels) to guide the learning process.
In the graphic above, the data might have features such as color and radius.
Unsupervised learning
The lack of labels is what makes this unsupervised learning.
Why use clustering?
One use for clustering is exploratory analysis - if you have a new dataset and are trying to learn about it before doing further analysis.
Clustering the data could uncover patterns that you didn't notice before, pointing you in a new direction for hypotheses to test.
K-means clustering
A common clustering algorithm is k-means clustering, where data samples are grouped into k number of clusters.
Scikit-learn has an implementation of k-means.
The number of clusters, k, is a hyperparameter, meaning you set its value before training the model.
Determining the best value for k can be challenging.
How it works
K-means has a few steps and is relatively simple.
- Decide on the number of clusters, k.
- The data is shuffled and k data samples are taken at random and initialized as the centroids or the center of each cluster.
- Next, iterate through all of the data points and assign each to the closest cluster - you can use the Euclidean distance to find the closest cluster.
- Then calculate the within-cluster sum-of-squares on each cluster, which gives you the mean of the data points in that cluster, and make that the new centroid.
Then repeat steps 3 and 4 until there are no more changes to the clusters, meaning the centroids have stabilized.
Or until a specified number of iterations has completed.
The goal is to minimize the within-cluster sum-of-squares.
Read more in the scikit-learn docs.
How to use the model
If I had a bunch of articles that were unlabeled and trained a k-means clustering model with them, I could then feed the model a new, unseen article as input, and it would output the cluster that the article belongs to.
Thanks for reading!
So that is a summary of classification vs clustering in machine learning.
Both aim to group data in a meaningful way, but classification defines how that should happen while clustering allows for inherent patterns in the features of the dataset to come out and groups the data based on them.
Let me know if you have any questions or comments by writing below or reaching out on Twitter @LVNGD.