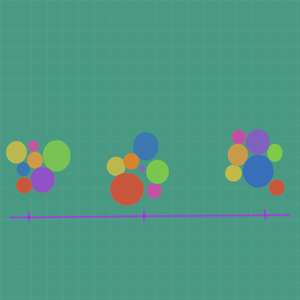
In this post we will be creating a multi-foci force layout with multiple clusters of elements.
The code for everything can be found here.
My data is counts of sleeve types mentioned in fashion blogs over different date ranges.
- long sleeves
- short sleeves
- puffy sleeves
- cap sleeves
- etc.
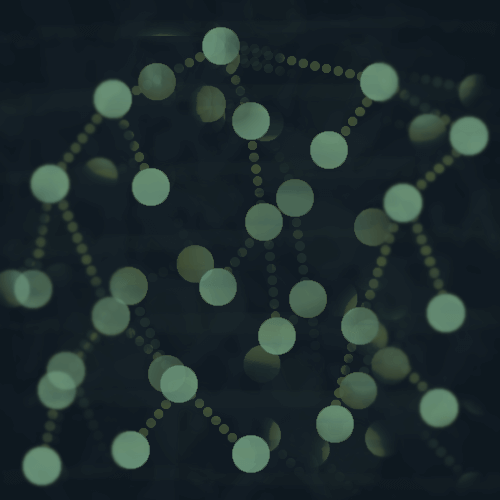
Each cluster represents a different date range, which you can see from the axis in the center that there are three date ranges for March 2020, April 2020, and May 2020.
The circle radius corresponds to the count/number of times that type of sleeve was mentioned in the date range.
Fashion blog text data
I collected fashion blog articles from a handful of sources and used a regular expression to extract the sleeve-related parts from the text.
Note: This is just a demo for this type of visualization and almost certainly not a representative sample of data about sleeve types - please don't make any important conclusions from this visualization.
I'm visualizing the top 10 sleeve types that were mentioned the most in the articles.
Data formatting
The data is a list of JSON objects, and each JSON object corresponds to one of the circles.
[{'type': 'sleeveless', 'count': 15, 'group': 0, 'group_name': 'March 2020'},
 {'type': 'jersey', 'count': 3, 'group': 0, 'group_name': 'March 2020'},
 {'type': 'puffy', 'count': 13, 'group': 0, 'group_name': 'March 2020'},
 {'type': 'short', 'count': 14, 'group': 0, 'group_name': 'March 2020'},
 {'type': 'cap', 'count': 4, 'group': 0, 'group_name': 'March 2020'},
 {'type': 'statement', 'count': 3, 'group': 0, 'group_name': 'March 2020'},
 {'type': 'balloon', 'count': 2, 'group': 0, 'group_name': 'March 2020'},
 {'type': 'long', 'count': 17, 'group': 0, 'group_name': 'March 2020'},
 {'type': 'bell', 'count': 5, 'group': 0, 'group_name': 'March 2020'},
 {'type': 'chiffon', 'count': 0, 'group': 0, 'group_name': 'March 2020'},
 {'type': 'sleeveless', 'count': 17, 'group': 1, 'group_name': 'April 2020'},
 {'type': 'puffy', 'count': 16, 'group': 1, 'group_name': 'April 2020'},
 {'type': 'short', 'count': 7, 'group': 1, 'group_name': 'April 2020'},
 {'type': 'balloon', 'count': 4, 'group': 1, 'group_name': 'April 2020'},
 {'type': 'long', 'count': 30, 'group': 1, 'group_name': 'April 2020'},
 {'type': 'bell', 'count': 2, 'group': 1, 'group_name': 'April 2020'},
 {'type': 'jersey', 'count': 0, 'group': 1, 'group_name': 'April 2020'},
 {'type': 'cap', 'count': 0, 'group': 1, 'group_name': 'April 2020'},
 {'type': 'statement', 'count': 0, 'group': 1, 'group_name': 'April 2020'},
 {'type': 'chiffon', 'count': 0, 'group': 1, 'group_name': 'April 2020'},
 {'type': 'sleeveless', 'count': 20, 'group': 2, 'group_name': 'May 2020'},
 {'type': 'puffy', 'count': 25, 'group': 2, 'group_name': 'May 2020'},
 {'type': 'short', 'count': 14, 'group': 2, 'group_name': 'May 2020'},
 {'type': 'cap', 'count': 2, 'group': 2, 'group_name': 'May 2020'},
 {'type': 'statement', 'count': 2, 'group': 2, 'group_name': 'May 2020'},
 {'type': 'chiffon', 'count': 4, 'group': 2, 'group_name': 'May 2020'},
 {'type': 'balloon', 'count': 7, 'group': 2, 'group_name': 'May 2020'},
 {'type': 'long', 'count': 26, 'group': 2, 'group_name': 'May 2020'},
 {'type': 'bell', 'count': 1, 'group': 2, 'group_name': 'May 2020'},
 {'type': 'jersey', 'count': 0, 'group': 2, 'group_name': 'May 2020'}]
Each has a sleeve type, the count for that time period, a group number designating the cluster it belongs to, and then the group name.
Building the visualization in D3.js
You can find the code for this visualization here.
In order to create the layout, first we set up a simulation.
var simulation = d3.forceSimulation()
    .force("charge", d3.forceManyBody())
    .force('collision', d3.forceCollide().radius(function(d){return d.radius;}))
    .force("center", d3.forceCenter(width / 4, 2*(height / 3)));
- The
charge force works to repel the nodes from each other.
- The
collision force keeps the circles from overlapping by detecting collision and repelling.
- The
center force moves the clusters to the area of the SVG where we want it to be - here it is on the left side and down a bit.
simulation
    .nodes(nodes)
    .on("tick", ticked);
Here the simulation is started, and calls a function for each tick.
function ticked() {
    var k = this.alpha() * 0.3;
    //move the nodes to their foci/cluster
    nodes.forEach(function(n, i) {
            n.y += (clusters(n.group) - n.y) * k;
            n.x += (0 - n.x) * k;
      });
    //update coordinates for the circle
    node
        .attr("cx", function(d) { return d.x; })
        .attr("cy", function(d) { return d.y; });
  }
The ticked function moves the nodes(circles) into position by moving them in the direction of their assigned cluster.
The alpha value updates as the simulation progresses until reaching a threshold where the simulation stops.
Colors
I just used d3.interpolateRainbow from d3-scale-chromatic.
You might notice that the colors for sleeveless and chiffon sleeves are very similar, if not the same.
So the colors could be improved!
Thanks for reading!
To create this visualization, I collected fashion blog articles from the following sources:
If you know of any interesting fashion-related blogs, please send them to me as well!
I have been working on a natural language processing project analyzing fashion blog text, and would like to include a wide variety of sources.
Preferably ones that are mainly text-based, or at least have some text.
If you would like a full list of the articles used, please contact me.
If you have any other questions or comments, write them below or feel free to reach out on Twitter @LVNGD.