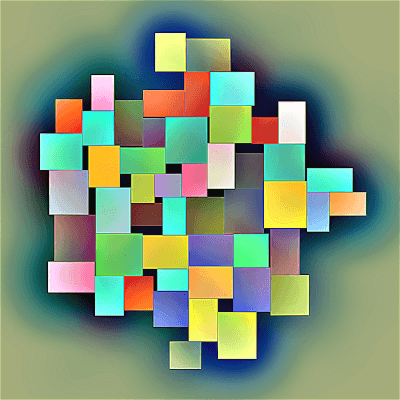
D3 has a built-in force to detect circle collisions in force layouts, but what if you're working with rectangles? In this post we will go over how to detect and resolve collisions, and then adapt D3's built-in forceCollide to work on rectangles.
Read MorePosts about visualization
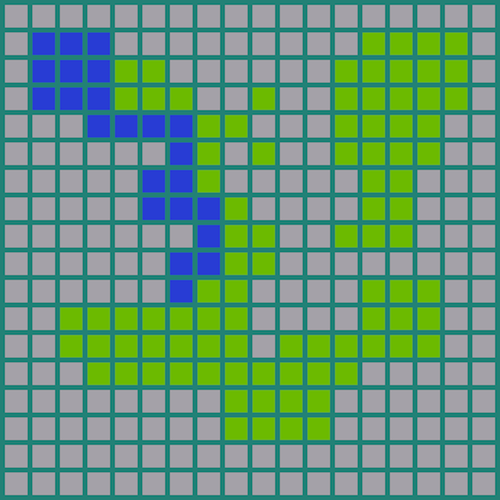
The flood fill algorithm has several high profile uses, most notably the bucket fill tool in image editing programs, as well as in games like Minesweeper. In this post we will go over how the tool works, as well as how to implement the algorithm.
Read More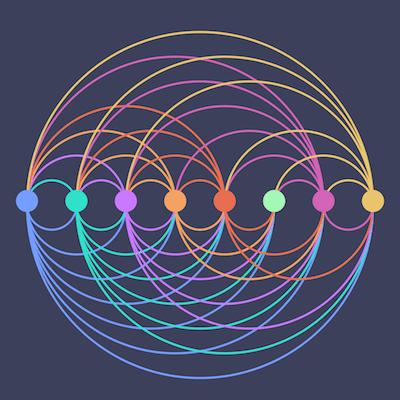
In part II of building arc diagrams in D3.js we will build the actual diagram with data from ride hailing app trips we prepared in Part I. Drawing the arc is the most complicated part of this visualization, and we will go through it step by step.
Read More
If you use a Google Font in an SVG visualization and then try to save it as a file, you might find that the font was not preserved in the saved file. To remedy that, we will look at how to embed a custom font into an SVG with base64 encoding.
Read More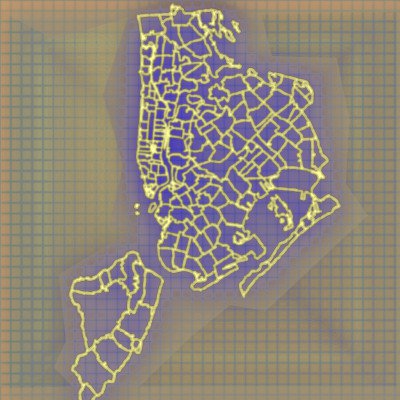
In this post we will use the ogr2ogr command line tool from GDAL to convert a shapefile of NYC zip code boundary data to GeoJSON format, as well as convert the projected coordinates to latitude and longitude, in one line of code.
Read More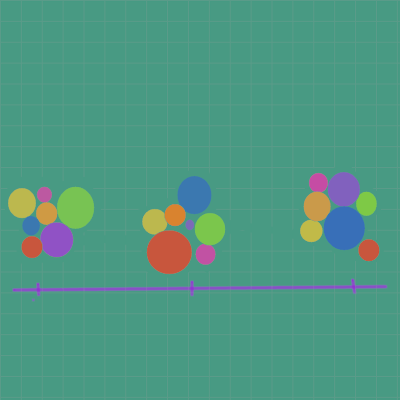
You might be familiar with force layouts in D3.js to create things like bubble charts, network graphs and many other types of visualizations. In this post we will create a force layout bubble chart with multiple clusters along a timeline.
Read More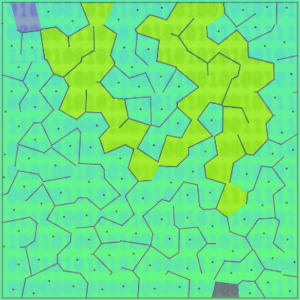
Voronoi diagrams are used in a variety of fields for a variety of reasons, including the art and design world. This post is Part II in a series on mazes, where I will generate and solve random mazes from Voronoi diagrams using Python and Matplotlib.
Read More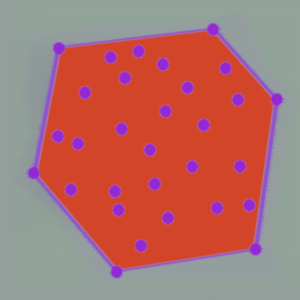
Computing the convex hull of a set of points is a fundamental problem in computational geometry, and the Graham scan is a common algorithm for it. In this post we will implement the algorithm in Python and look at interesting uses of convex hulls.
Read More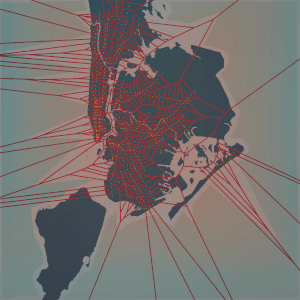
A Voronoi diagram divides up a space into regions of influence based on a set of points. In this post we will generate a Voronoi diagram from a map of NYC subway station locations, which can be used to find the closest subway station to any location.
Read More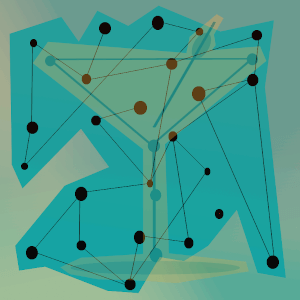
For many of us, going out to restaurants and bars is but a distant memory, and you might want to make your own cocktails at home. In this post we will build a program in Python to tell you what cocktails you can make from a list of input ingredients.
Read More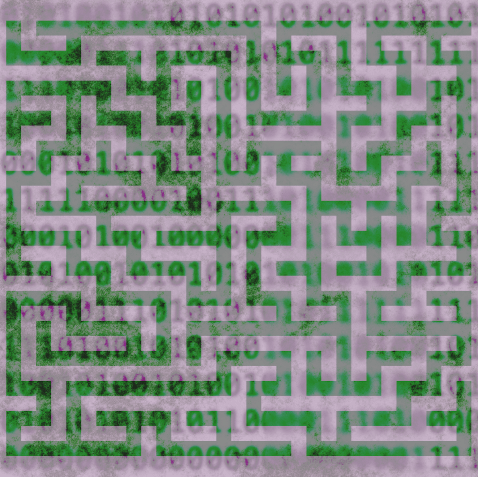
We've been into mazes for thousands of years. Some can be tricky to navigate, but we can solve them pretty quickly in a few lines of code, using well-known path-finding algorithms. All visualized in matplotlib.
Read More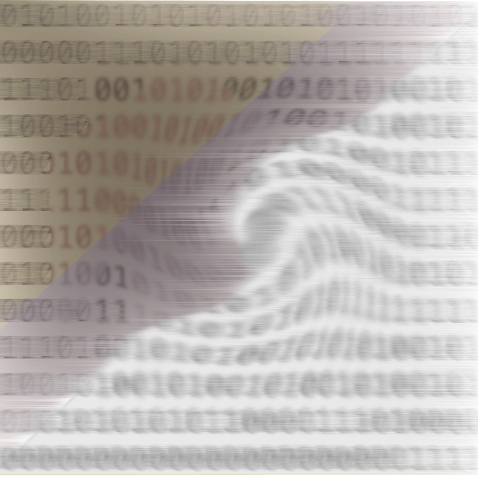
Today I will go over what a force-directed graph is and how to build one in D3.js. This graph is built using data extracted from New York Times articles to show items that are talked about in the articles.
Read More