When working with D3, you often start with an array of data objects that you want to join together with DOM elements to build your visualization.
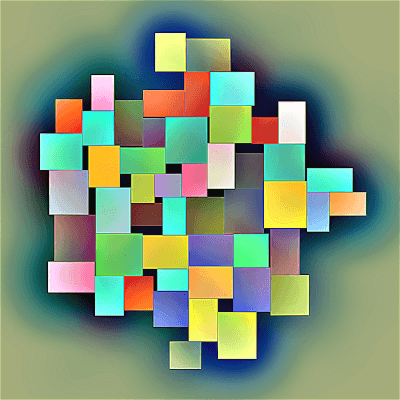
In this post we are starting with a grid of SVG circles.
Find the code for everything here.
Check the sidebar for my original post on creating a grid of elements in D3 - this animation is an extension of that idea.
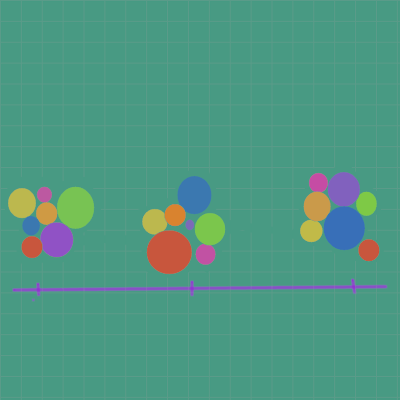
Random subsets of circles
For each interval in the animation, a random subset of circles from the grid are displayed.
First we will generate the data for all of the circles, and then in each iteration, get a random subset of them to display.
This grid has 12 rows and 12 columns, so 144 circles in total.
const numRows = 12,
numCols = 12,
numNodes = numRows * numCols,
radius = 16;
And we've set the circle radius as a constant here, since they will all be the same size.
Generate the data
We will generate an array of 144 data objects to correspond to each circle in the grid, and each will contain the information needed to draw and place the circle in the SVG.
const circleNodes = d3.range(numNodes).map(function(i) {
    return {
        id: i,
        radius: radius,
        x: x(i%numCols),
        y: y(Math.floor(i/numCols))
    };
});
The data objects will look like this:
[
    {
        id: 0,
        radius: 16,
        x: 0,
        y: 0
    },
    {
        id: 1,
        radius: 16,
        x: 33.333333333333336,
        y: 0
    },
    ...
]
The x and y coordinates of the circles are calculated from x and y scales - check out the original grid post in the sidebar for more on that.
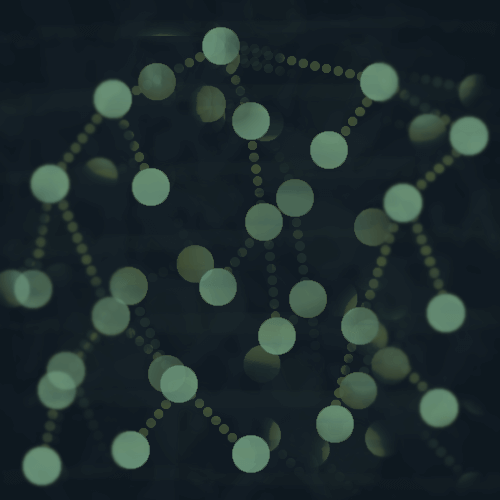
Enter, Update and Exit
There are three states of the data in a D3 data join, and this animation demonstrates the full cycle of them.
- Enter selection
- New data is joined to new elements.
- These are the yellow-green circles in the animation.
- The animation starts with all yellow-green circles.
- Update selection
- Data is joined to existing elements.
- These are the darker, muted green circles.
- If a circle starts off as yellow-green and its data point is still present in the next animation iteration, it should turn to muted green.
- Exit selection
- Any unbound elements that will be removed.
- If a circle was present in one iteration and then its data point is not present in the next, it goes into the exit selection.
- The circles making up the exit selection are shown with a decreased opacity and then transition to removal.
We've defined an update function that handles the data join:
function update(nodes){
    let t = d3.transition()
      .duration(750);
    let circles = container.selectAll("circle")
        .data(nodes,d=>d.id);
    circles
        .join(
            enter => enter.append("circle")
                          .attr("fill", enterColor),
            update => update
                          .attr("fill", updateColor),
            exit => exit
                          .style("opacity", 0.4)
                          .call(e => e.transition(t).remove())
            )
        .attr('cx', d => d.x)
        .attr('cy', d => d.y)
        .attr('r', d => d.radius)
}
If you refresh the page, the animation will start over and you will notice that all of the circles start out as the light yellow-green.
This is because the visualization starts with all of the data joined to the circles.
After that, we call the update function with random subsets of the circles in an interval loop.
Data join key function
We need to make sure that there is a way to keep track of which data points correspond to which circles throughout the animation, as we cycle through new subsets of circles.
To start off the data join code, we have:
let circles = container.selectAll("circle")
    .data(nodes,d=>d.id);
- The part
d => d.id is the key function.
- It keeps track of which objects are represented by which circle object, otherwise known as object constancy.
- Each data object has a unique id, that was incrementally generated, since the data is generated from the number of circles in the grid, so we use that as the key.
What happens if we don't define a key function?
The animation should work as follows:
- If a circle is yellow-green(the enter selection) and is still present in the next iteration of the animation, it should turn to muted green.
- If a circle's opacity is lowered(the exit selection), then it should disappear shortly after.
- A circle should not go immediately from muted green to yellow green, unless an iteration has passed where it has disappeared. This would mean it went from update to enter, which does not make sense.
If you remove the key function and run the animation, you will notice at some point that the color changes don't quite add up, and one of the previous "rules" has been violated.
Getting a random subset of circles
After calling the update function on the full dataset to start off, we will set up an interval where a new subset of circles is passed to the update function.
d3.interval(function() {
  update(d3.shuffle(circleNodes)
      .slice(0, getRandomInteger(5,circleNodes.length)));
}, 2500);
- Shuffle the array
circleNodes - there is a handy d3.shuffle() function available for that.
- Then slice the shuffled array from the first element to a random integer between 5 and the length of the full data array. I did this to make sure that there would be at least a minimum number of circles in each iteration.
Static visualizations
If you've mainly worked with static visualizations, you might only need to worry about the enter selection, but to create an animation with changing data, you will need to think about the full cycle of enter/update/exit.
Thanks for reading!
Let me know if you have questions or comments by writing them below, or reaching out...