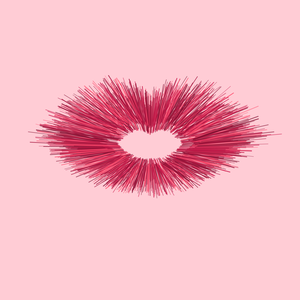
So in this post I will go through how I created this puckering lips animation.
You can also find the code on my Observable, here.
The Basic Steps
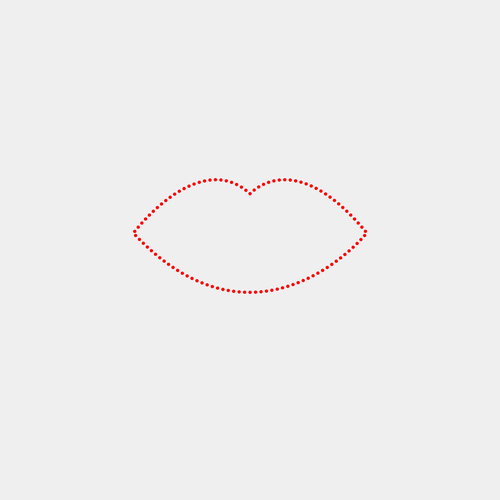
- I started with an SVG path of an outline of lips.
- Found points along the path of the lips.
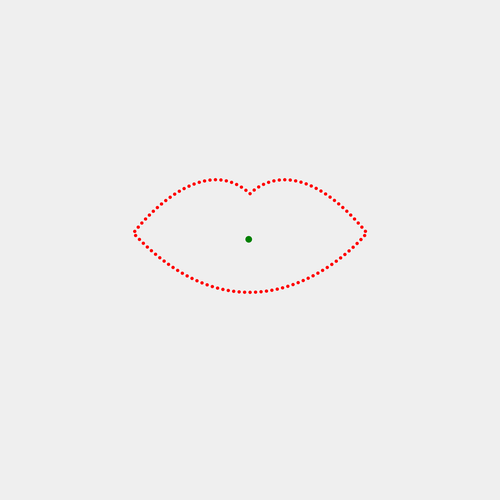
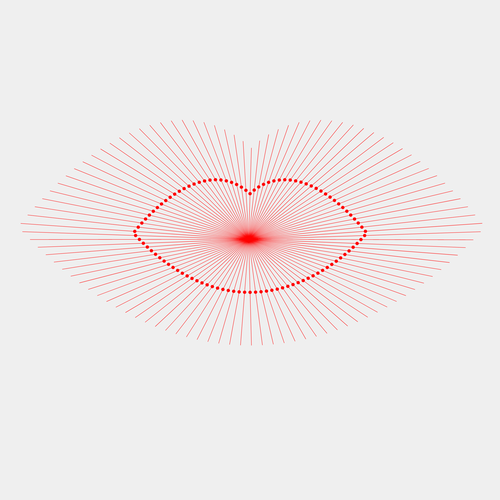
- Drew lines between each point and the center of the lips.
- Animated the lines by interpolating the x1,y1,x2 and y2 values of each line.
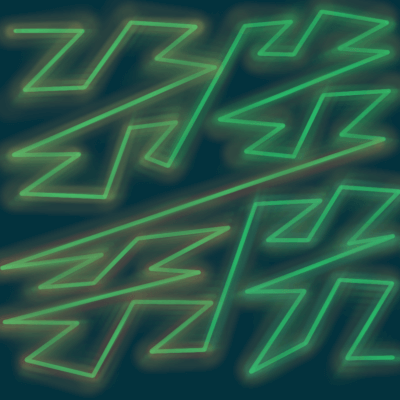
As the animation progresses, the length of the lines change, to make it look like the lips are puckering up for a kiss.
D3 concepts used
Some of the concepts you will learn about in this post:
- SVG paths
- D3 transitions and .attrTween
- D3 interpolations
- Trigonometry! (Don't be frightened...)
Alright, let's get started.
SVG path of lips
First, create or obtain an SVG path of lips.
I used this one from the Noun Project, by Star and Anchor Design.
I just extracted the part of the file that is the path of the lips and copy and pasted it into my file.
let lipsPath = "m695.88 293.71c-100.43-120.44-182.21-154.64-242.43-154.66-55.621 0.10156-90.73 28.961-103.78 42-32.375-29.973-67.734-42.199-102.37-42.125-126.72 1.0078-242.47 154.82-243.28 155.05l-4.0234 5.2227 4.5352 4.7891c122.2 128.78 240.43 172.67 343.34 172.67h0.21484c205.98-0.39453 347.2-172.61 347.82-173.07l4.0781-4.9531zm-36.418 26.027c-48.258 47.316-163.72 141.6-311.38 141.46-97.207-0.0625-209.15-40.254-327.7-162.98 3.3359-4.0703 8.6133-10.352 15.613-18.125 37.785-42.434 125.84-126.23 211.31-125.71 32.926 0.078125 65.688 11.742 97.223 43.176l6.1328 6.1406 5.3984-6.7969c0-0.015625 1.832-2.3477 5.957-6.3047 12.453-11.957 43.508-36.102 91.441-36.086 53.195-0.015625 129.38 29.68 226.35 144.08-4.0156 4.4883-10.844 11.867-20.34 21.152z"
Create the SVG for our visualization
First let's create our SVG, along with a container element to hold the animation.
const svg = div.append('svg')
        .attr("viewBox", [0, 0, 1500, 1500])
        .style("background-color", svgBackgroundColor),

    container = svg.append("g")
    .attr("id", "container")
        .attr("transform", `translate(${400}, ${400})`),
Calculating points along the lips path
Now we are going to use a couple of SVG path methods to calculate some points along the lips path.
The first thing I had to do was to append the lips path icon to the SVG.
const lipsDrawing = svg.append("defs")
            .append("g")
            .attr("id","iconCustom")
            .append("path")
            .attr("id", "lipsPath")
            .attr("d", lipsPath)
I'm only using this to calculate the points along the path, so I am not actually going to draw the path on the SVG.
Now we can use a couple of SVG path element methods to calculate the points along the path.
SVGGeometryElement methods .getTotalLength() and .getPointAtLength()
Now we are going to get the total length of the lips path, and then divide it by the number of points we want to draw along it.
These points will be the lines in the animation.
Get the total length of the path:
let lpLength = d3.select('#lipsPath').node();
let totalLength = lpLength.getTotalLength();
Here I selected the path node that I appended to the SVG - I gave it the ID #lipsPath just to make it easier to select.
Then I called the getTotalLength() method on this element.
Now we can divide the total length by the number of points.
How many points do we want to get?
This is something where you can experiment a bit, but for demo purposes, let's start with 100.
Now let's generate some initial data points.
let dataPoints = d3.range(numPoints).map(point => {
    let step = point * (totalLength/numPoints);
    let pt = lpLength.getPointAtLength(step);
    return {
        x: pt.x,
        y: pt.y
    }
})
I've divided the path into sections or steps, where each step has length totalLength/numPoints, and then multiplied by the current point number to get the correct location along the path.
The SVG path element method, .getPointAtLength(), returns the x and y coordinates of each point along the path in SVG user units.
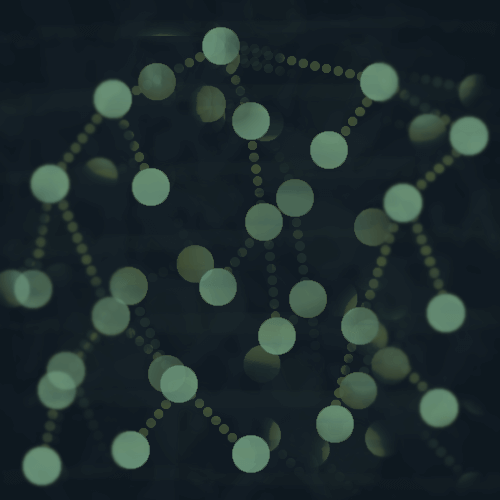
Here are the current points.
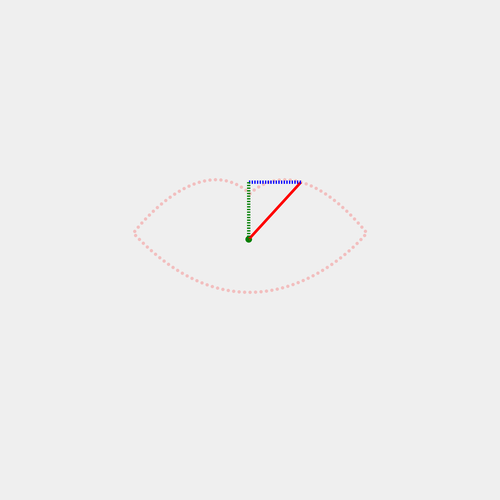
If you remember SOHCAHTOA, we already know the opposite and adjacent sides of the triangle, so we can get the angle theta with tangent.
- The line connecting each point to the center is the hypotenuse of a right triangle, giving us the distance between the point and the center of the lips path.
- The green dashed line is the opposite side.
- The blue dashed line is the adjacent side.
let data = dataPoints.map(pt => {
    let hyp = Math.sqrt(Math.pow(Math.abs(centerPoint.y - pt.y), 2) + Math.pow(Math.abs(centerPoint.x - pt.x), 2));

    theta = Math.atan2((pt.y - centerPoint.y), (pt.x - centerPoint.x));

    return {
        x: pt.x,
        y: pt.y,
        centerDist: hyp,
        theta: theta
    }
})
This is the data we will pass to D3 to create the lines.
Draw the lines
Let's do a quick data join.
let lipLines = container.selectAll('line')
    .data(data)

lipLines.join(
    enter => enter.append('line')
        .attr("stroke", "red")
        .attr('x1', d => {
            let x1 = d.x + (d.centerDist * Math.cos(d.theta));
            return x1
        })
        .attr('y1', d =>{
            let y1 = d.y + (d.centerDist * Math.sin(d.theta));
            return y1
        })
        .attr('x2', d =>{
            let x2 = d.x - (dist * Math.cos(d.theta));
            return x2;
        })
        .attr('y2', d =>{
            let y2 = d.y - (dist * Math.sin(d.theta));
            return y2;
        })
    )
x2 and y2
As I mentioned earlier with SOHCAHTOA, we have the centerDist for each point, which is the distance between it and the center of the lips path - the hypotenuse of the triangle.
- Cosine Θ = adjacent / hypotenuse
- Sine Θ = opposite / hypotenuse
To find the x coordinate of the center, multiply Cosine Θ by the hypotenuse, and then. subtract that value from d.x.
To find the y coordinate of of the center, multiply Sine Θ by the hypotenuse, and subtract that value from d.y.
x1 and y1
I mentioned that I am actually doubling the size of the lips for this animation, and to do that I extended the line further out, simply by adding the Cosine/Sin * hypotenuse calculation to d.x and d.y.
Here's an image with these lines, as well as the circles from earlier to show the original points.
Adjusting the lines a bit
This is just me experimenting.
Now we have some static lines between the path points and the center, and they kind of overlap a bit, so I experimented and found that for this animation, an ideal distance is about 150.
So I just made sure that the distance did not exceed 150 in length by adjusting the second point of each line, x2 and y2.
.attr('x2', d =>{
    let dist = d.centerDist < idealDist ? d.centerDist : d.centerDist;
    let x2 = (d.x - (dist * Math.cos(d.theta)));
    return x2;

})
.attr('y2', d =>{
    let dist = d.centerDist < idealDist ? d.centerDist : d.centerDist;
    let y2 = (d.y - (dist * Math.sin(d.theta)));
    return y2;
})
Animating it
Now we are ready to animate the lips.
So far we have only used the enter part of the enter, update, exit join pattern.
Now we will add the update part, with a transition to animate the line lengths.
It looks like a lot, but I am doing the same thing for each point, just substituting some different numbers or cosine/sine.
I will go over what is happening here below!
update => update.call(e => e.transition(t)
            .attrTween("x1", d => {
                let dist = d.centerDist < idealDist ? d.centerDist : d.centerDist;
                let x1 = d.x + (dist * Math.cos(d.theta));
                let x11 = d.x + ((dist/getRandomInteger(2,5)) * Math.cos(d.theta));
                let intp = d3.interpolate(x1,x11);
                return t => {
                    return intp(t);
                }
            })
            .attrTween("y1", d => {
                let dist = d.centerDist < idealDist ? d.centerDist : d.centerDist;
                let y1 = d.y + (dist * Math.sin(d.theta));
                let y11 = d.y + ((dist/getRandomInteger(2,5)) * Math.sin(d.theta));
                let intp = d3.interpolate(y1,y11);
                return t => {
                    return intp(t);
                }
            })
            .attrTween("x2", d => {
                let dist = d.centerDist < idealDist ? d.centerDist : d.centerDist;
                let x2 = d.x - (dist * Math.cos(d.theta));
                let x22 = d.x - ((dist/getRandomInteger(2,5)) * Math.cos(d.theta));
                let intp = d3.interpolate(x2,x22);
                return t => {
                    return intp(t);
                }
            })
            .attrTween("y2", d => {
                let dist = d.centerDist < idealDist ? d.centerDist : d.centerDist;
                let y2 = d.y - (dist * Math.sin(d.theta));
                let y22 = d.y - ((dist/getRandomInteger(2,5)) * Math.sin(d.theta));
                let intp = d3.interpolate(y2,y22);
                return t => {
                    return intp(t);
                }


             })

            )

        )
What is .attrTween() doing?
Let's look at x1.
.attrTween("x1", d => {
    let dist = d.centerDist < idealDist ? d.centerDist : d.centerDist;
    let x1 = d.x + (dist * Math.cos(d.theta));
    let x11 = d.x + ((dist/getRandomInteger(2,5)) * Math.cos(d.theta));
    let intp = d3.interpolate(x1,x11);
    return t => {
        return intp(t);
    }
})
We are using a couple of D3 concepts here.
- Interpolation
- .attrTween()
The code starts off the same as before, with the x1 value we calculated in the enter part of the join.
But then we want to change the size of the line, so we need to calculate where we want the x1 point to move to.
I wanted to introduce some randomness to this to make it more interesting.
dist/getRandomInteger(2,5)
So here the distance will be divided by some random number between 2 and 5.
Feel free to play around with that.
Interpolation
Now we need to interpolate the x1 values between these two numbers, x1 and x11.
So we can do that with d3.interpolate() which takes in two numbers and returns a function that you can pass in a range from [0,1] and it will return an interpolated value. See the docs for more.
.attrTween()
With attrTween, we are simply defining the interpolator, and then returning a new function that takes a time, t from 0-1.
let intp = d3.interpolate(x1,x11);
    return t => {
        return intp(t);
    }
Notice that I've done the same thing for y1, x2 and y2 as well.
Puckering
One other detail is that when you pucker your lips, generally the two sides come in a bit, so I wanted to account for that somehow in this animation.
I created a puckerScale for this as an experiment.
let puckerScale = d3.scaleLog()
        .domain(d3.extent(data, d => d.centerDist))
        .range([0,1]);
The domain is the min to max values of the centerDist attribute, and the range is just 0 to 1.
I used a log scale because I didn't want there to be to much change for the smaller values, and only really wanted the largest values to be affected.
I only used this on the x1 values, and you will see that I also divided it by 3, which was just another experimentation where I liked the end result.
.attr('x1', d => {
    let dist = d.centerDist < idealDist ? d.centerDist : d.centerDist;
    let x1 = d.x + ((puckerScale(dist)/3 * dist) * Math.cos(d.theta));
    return x1

})
And in the update transition.
.attrTween("x1", d => {
    let dist = d.centerDist < idealDist ? d.centerDist : d.centerDist;

    let x1 = d.x + ((puckerScale(dist)/3 * dist) * Math.cos(d.theta));
    //let x1 = d.x + (dist * Math.cos(d.theta));
    let x11 = d.x + ((dist/getRandomInteger(2,5)) * Math.cos(d.theta));
    let intp = d3.interpolate(x1,x11);
    return t => {
        return intp(t);
    }
})
Other experiments
I also changed the color, stroke-width and opacity of the elements throughout the animation.
let colors = ["590d22","800f2f","a4133c","c9184a","ff4d6d","ff758f"];
I just browsed color palettes on Coolors for these.
In the enter and update functions, I adjusted the attributes.
.attr("stroke", d => `#${colors[getRandomInteger(1,colors.length-1)]}`)
I changed the stroke to a random color from this palette of reds and pinks.
.attr("stroke-width", (d,i) => Math.random() * 10)
.style("opacity", (d,i) => Math.random())
Then I change the stroke-width and opacity to a random number.
Noise
I've also experimented with noise functions - one in particular from P5.js.
And then I used noise for the above attributes, aside from color.
.attr("stroke-width", (d,i) => noise.noise(i) * 7)
.style("opacity", (d,i) => noise.noise(i))
Thanks for reading!
I'm sure there are countless other ways you could experiment with this as well!
Let me know if you experiment with this code, or come up with something else!