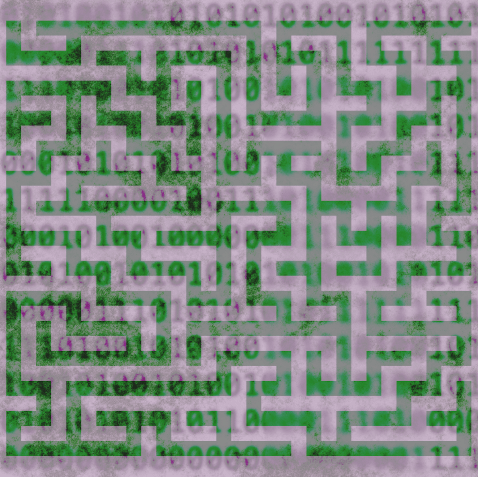
This animation shows the maze being solved with a backtracking algorithm, with the path in green and the backtracking steps in purple.
What is a Voronoi diagram?
A Voronoi diagram, also called a Voronoi tesselation, is computed by partitioning a space into regions called cells based on a set of objects or seed points.
It's a nearest-neighbors map of these points.
Any point within a Voronoi cell is closer to the seed point in that region than any other seed point.
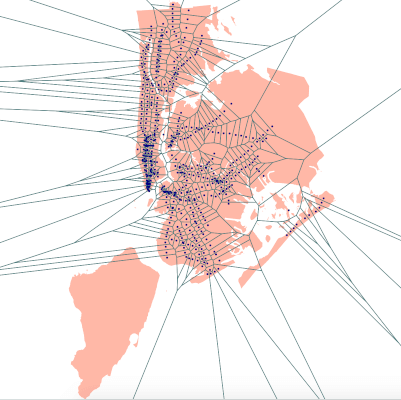
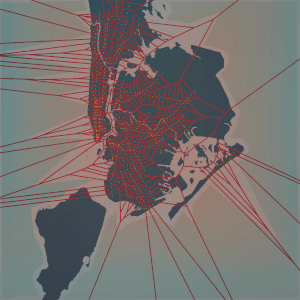
The subway stations (their latitude, longitude coordinates) are the seed points to compute the Voronoi diagram, where each subway station point is enclosed by a Voronoi cell.
To find the closest subway station to a location, you simply find the Voronoi cell that contains that location, and the subway station corresponding to that cell is the closest one.
We can also use random points to generate a Voronoi diagram and then break down some of the cell walls to create a maze.
Voronoi cells are convex polygons, so instead of starting with a grid of squares for this maze, we have bunch of polygons with a variable number of sides in the space.
Generating a Voronoi Diagram
Of course we could implement an algorithm to generate a Voronoi diagram ourselves.
Generating a Voronoi diagram from a set of points with SciPy is straightforward.
import random
from scipy.spatial import Voronoi

#list of random points for this example
points = [(random.randint(0,100),random.randint(0,100)) for i in range(100)]
vor = Voronoi(points)
How to create a maze from a Voronoi diagram
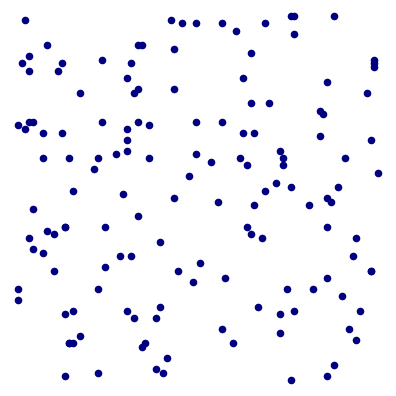
First we need a set of seed points.
Any old random points like I generated above can lead to a very uneven distribution of points, where you would have clumps of Voronoi cells.
That may or may not bother you, but in this case I wanted the maze to be a bit more even and somewhat uniform.
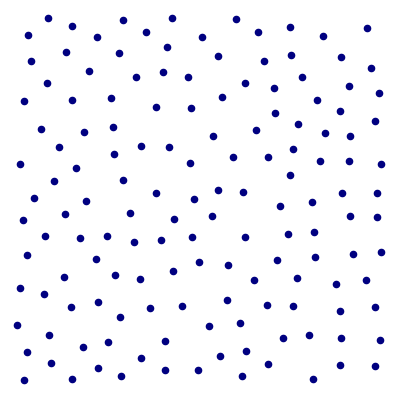
Poisson-Disk sampling
So instead we will generate a set of random points where the points are packed together as tightly as possible into the boundaries we want for the maze, but all points are also separated by at least a minimum distance.
Much better.
So we will use Poisson-disk sampling to generate a set of seed points to feed to SciPy to generate the Voronoi diagram.
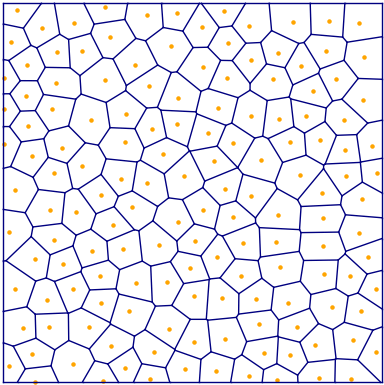
Here is the resulting Voronoi diagram, and now it's time to turn it into a maze.
Carving out the maze
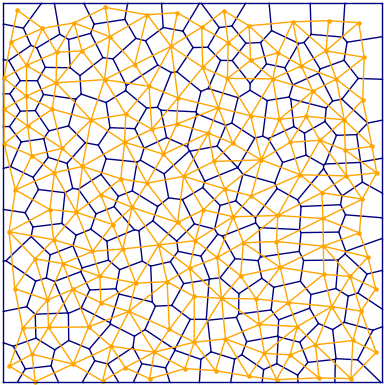
A maze can be viewed as a graph.
A graph has nodes and edges, where the edges connect pairs of nodes.
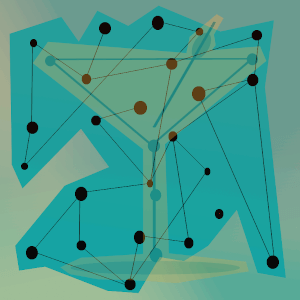
The points that we just generated and used to construct the Voronoi diagram are the nodes of this graph.
Each point is a neighbor of other points that it shares a Voronoi cell edge with, so there is an edge between a point and each of its neighbors.
The orange edges show these neighbor relationships, and are the edges we will traverse over for both creating and solving the mazes.
In the 2-D grid maze, the neighbors were simply the cells to the top, right, left and bottom - and you could allow for diagonals as well.
Breaking down walls
Now it's time to break down the walls between some of these neighbors.
In my other maze post, I used Kruskal's algorithm to find a minimum spanning tree, which results in a graph where all vertices are connected by a subset of the edges, with no cycles.
This time I am going to use a randomized depth-first search algorithm to generate the maze.
This algorithm will traverse the neighbor graph above, and randomly pick walls of the Voronoi cell polygons to remove.
Randomized depth-first search
This is a backtracking algorithm that starts with a random seed point and proceeds in a depth-first search, picking random neighbors and breaking down the walls between them.
Look at its neighbors and pick a random neighbor that hasn't yet been visited.
Remove the Voronoi cell wall between the current cell and the random neighbor.
If there are no unvisited neighbors, backtrack to the last point that has unvisited neighbors and continue.
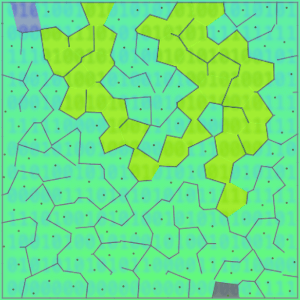
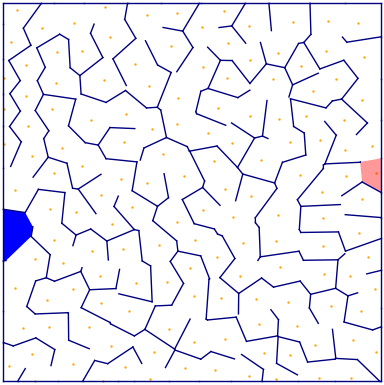
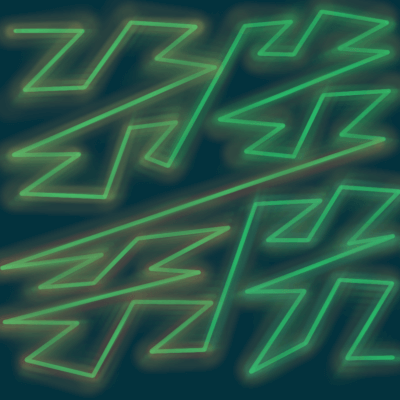
Now the maze is complete, with an entrance marked by the blue polygon, and the exit is marked by the red polygon.
After carving out the maze paths, we also have a list of legal edges that can be traversed when solving the maze.
A Voronoi cell wall bisects two nodes, and so whenever a wall is removed, the edge between those two nodes is added to the list as a legal step when solving the maze.
In this maze at least, we don't allow walking through walls, so when solving the maze, if an edge we want to traverse is not in the list of legal edges, it means there is a wall blocking that path, so we can't move there.
Solving the maze
Use any of your favorite path-finding algorithms to solve the maze.
Breadth-first search
Breadth-first search is a fundamental path-finding algorithm where the algorithm explores paths in layers, which is why it fans out the way it does.
It starts with a node and explores all of its neighbors at each level or layer before moving to the next.
Breadth-first search can be used to find the shortest path from one point to another in a graph.
Backtracking depth-first search
This is the same visualization you saw at the top of the post.
This backtracking depth-first search algorithm to solve the maze is similar to the randomized backtracking algorithm used to generate it.
Depth-first search is different than breadth-first search because it explores a path from one neighbor as far as it can before coming back and moving to the next neighbor.
With backtracking, the path is built incrementally, and when a path is found to be non-viable, the algorithm tries to correct by taking a step back and then seeing if it can keep going in a different direction.
Dijkstra's algorithm
Dijkstra's algorithm is basically breadth-first search for weighted graphs.
This graph has weights assigned to the edges that are based on the distance from the exit.
When it picks the next neighbor cell to move to in the path, it will pick the one that is closer to the exit.
Path planning with Voronoi diagrams
Another use for Voronoi diagrams is in path planning.
If the seed points used to generate the Voronoi diagram represent obstacles that you want to avoid, then a safe path to follow would be along the edges of the Voronoi diagram.
Thanks for reading!
If you have any questions or comments, leave them below or reach out to me on Twitter @LVNGD.
Starting out with general purpose computing on the GPU, we are going to write a WebGPU compute shader to compute Morton Codes from an array of 3-D coordinates. This is the first step to detecting collisions between pairs of points.
In this post, I am dipping my toes into the world of compute shaders in WebGPU. This is the first of a series on building a particle simulation with collision detection using the GPU.
Finding the Lowest Common Ancestor of a pair of nodes in a tree can be helpful in a variety of problems in areas such as information retrieval, where it is used with suffix trees for string matching. Read on for the basics of this in Python.