April 19, 2020
Finding the nearest NYC subway station with a Voronoi map
A Voronoi diagram represents regions of influence of a set of points or objects in a space.
It can be used for nearest-neighbor queries.
For example, if you were in New York City and wanted to find the closest subway station to your location.
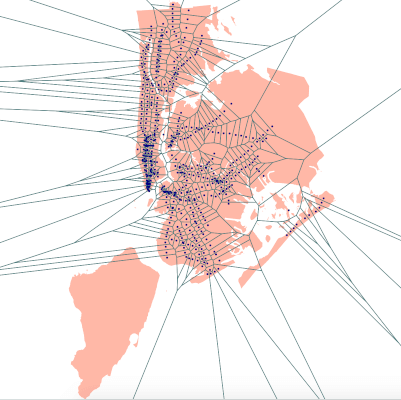
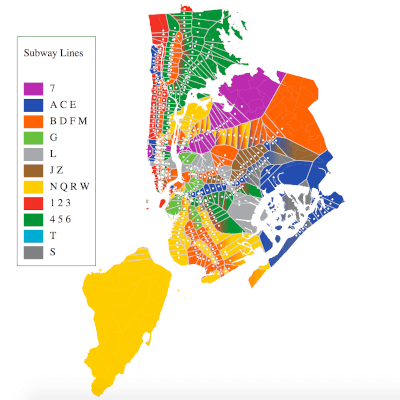
In this post we will create a Voronoi map of subway stations in NYC, using D3.js.
The code can be found here.
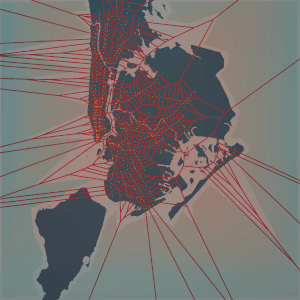
To create a Voronoi diagram, you start with a set of seed objects or points.
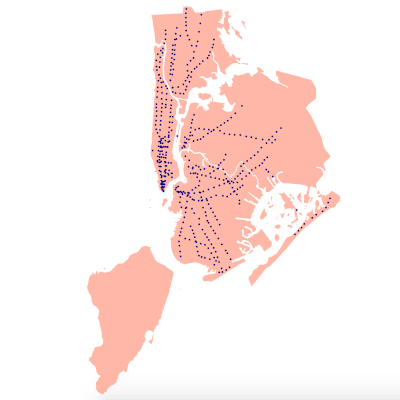
In this case we're using the latitude, longitude coordinates for the subway station locations.
Then the space - the map of NYC - is partitioned into regions, with each region containing a subway station location point.
A common algorithm for generating a Voronoi diagram from a set of points is Fortune's sweep line algorithm.
In each region, any other point (latitude, longitude coordinate pair) in that region is closer to the subway station in that region than to any other subway station on the map.
So this diagram can be used to find the closest subway station to any other location in NYC.
If you have the latitude,longitude coordinates of a location in NYC, then you can just figure out which Voronoi region that point is located in, and the subway station in that region is the closest one.
NYC Open Data
To create the map I've used two datasets from NYC Open Data.
There is also a dataset available of subway entrances, but there are a LOT more subway entrances than subway stations.
If you're familiar with the NYC subway, there could be multiple subway entrances for each station, with many right across the street from each other, so in the interest of keeping things less cluttered, I stuck with the station locations.
Drawing the map
I've used D3.js V4 to draw this map, and also to generate the Voronoi diagram.
D3.js has an implementation of Fortune's algorithm in d3.voronoi() to compute a Voronoi diagram from a set of points.
You can also use D3-delaunay -- note that d3.voronoi() has been deprecated, but it is bundled with D3.js V4, so I'm using it here.
The Delaunay Triangulation of a set of points corresponds to its dual graph of the Voronoi diagram.
You can construct the Voronoi diagram from the Delaunay Triangulation and vice versa.
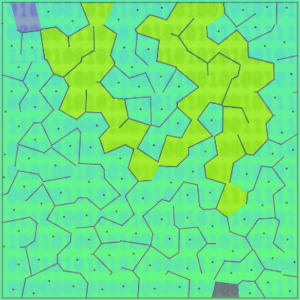
The subway map can be made a bit more interesting by coloring in the cells based on the subway line colors, as well as clipping the Voronoi diagram to the map.
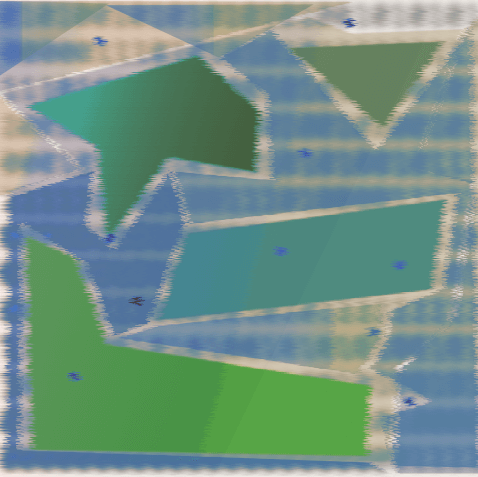
Point in polygon
If you wanted to use this in a GIS application, maybe a basic (likely mobile) application to tell someone the closest subway station based on their current location, you could store the Voronoi polygons, along with their subway station information, in a GIS-enabled database such as POSTGIS.
Then do a point in polygon query to find the Voronoi polygon the user's location lies in, and from there get the corresponding subway station.
Thanks for reading!
Finding the nearest subway station is one practical use for Voronoi diagrams, but they have a lot of other applications in a wide range of fields.
For example...
And many others!
Feel free to write any questions or comments below, or reach out on Twitter @LVNGD.