An arc diagram is a type of network graph where the nodes lie along one axis, with arcs connecting them. This post is part one of two, where we will prepare the data to visualize pickup and dropoff locations for ride hailing app rides in NYC.
Read MorePosts about nycopendata

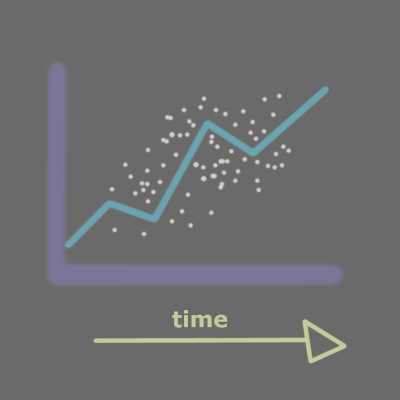
Time series data is all the rage these days, and not just in fields like finance. In this post we will look at working with time series data in Pandas, how to do basic time-based manipulations and calculations such as rolling means and data shifting.
Read More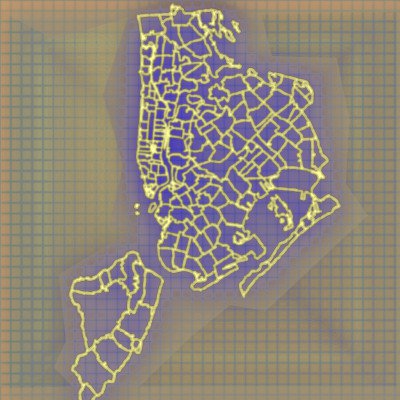
In this post we will use the ogr2ogr command line tool from GDAL to convert a shapefile of NYC zip code boundary data to GeoJSON format, as well as convert the projected coordinates to latitude and longitude, in one line of code.
Read More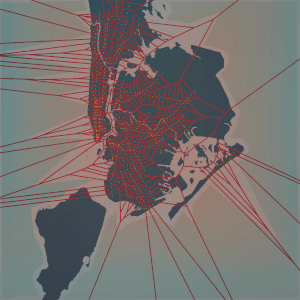
A Voronoi diagram divides up a space into regions of influence based on a set of points. In this post we will generate a Voronoi diagram from a map of NYC subway station locations, which can be used to find the closest subway station to any location.
Read More
Feature Engineering is an important skill in data science, and is the process of taking raw data and turning it into features that can be used as inputs for training machine learning algorithms. We will look at 311 noise complaints data in this post.
Read More
Cleaning up dirty, corrupted data with Python and Pandas. Dirty, corrupted data leads to dirty and corrupt analysis and conclusions. Who wants that? In this post we will go through a cleaning checklist with Pandas and a dataset from NYC Open Data.
Read More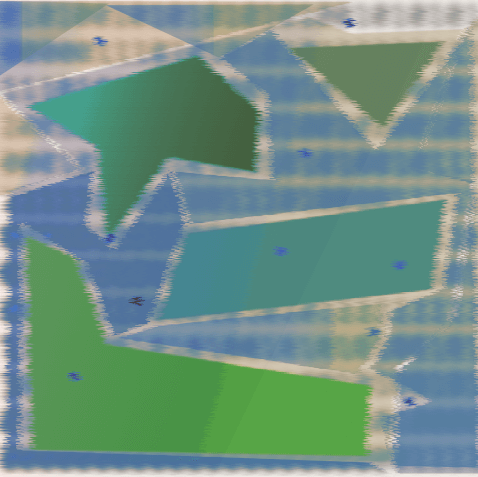
Determining if a point lies in a polygon is a pretty common task in computational geometry. In this post we will use it to answer questions like 'which NYC neighborhood is this apartment building in?' using GeoDjango and data from NYC Open Data.
Read More
If the walls in NYC could talk, they would likely tell you a similar story as one you can glean from 311 complaints. Noise complaints, building complaints, rat sightings, etc. NYC Open Data provides us this data, which we can access using Python.
Read More