June 20, 2020
Using ogr2ogr to convert Shapefiles to GeoJSON
Fireworks are a great summer pastime, and another great pastime here in NYC is complaining.
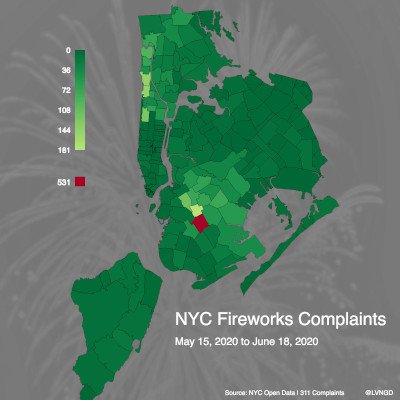
Put the two together and you've got fireworks complaints.
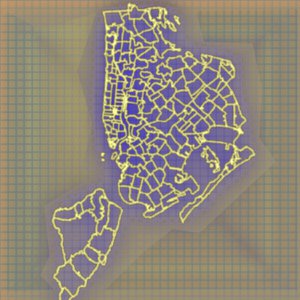
This map was created from NYC zip code boundaries GIS data, which comes as a shapefile that you can download from NYC Open Data.
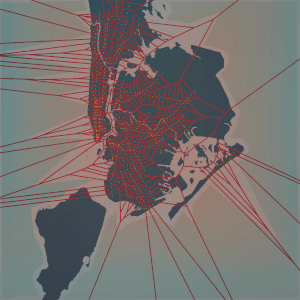
The focus of this post is just on preparing the zip code boundaries data, but not actually creating the map - you can find the code for the map here.
We will use a command line tool called ogr2ogr from the GDAL library.
If you're familiar with GIS data, feel free to skip right to the command.
To-do
- Convert the zip code shapefile into GeoJSON format.
- We will also be converting the map data from its current projected coordinate system into latitude and longitude coordinates.
We can do all of this with one command using ogr2ogr.
Working with GIS data
These are the files you will get if you download the zip code boundaries data, as of June 2020.
ZIP_CODE_040114.dbf
ZIP_CODE_040114.sbn
ZIP_CODE_040114.shp
ZIP_CODE_040114.shx
ZIP_CODE_040114.prj
ZIP_CODE_040114.sbx
ZIP_CODE_040114.shp.xml
The shapefile is ZIP_CODE_040114.shp, and this is the file we are most concerned with.
A shapefile contains data that describes geographic features.
If you look at the zip code map above, you can see that each zip code area makes up a polygon, and the data describes the boundaries of these polygons.

The data contains the coordinates that make up each of the polygons, as well as any other attributes about the data you might want to include, such as the zip code associated with each polygon.
In another post about working with GeoDjango, I used the GDAL library to examine a shapefile and the attributes it contains.
I won't go into that in this post, but if you are interested please check it out here.
Projected coordinate systems
This zip code data is in the Lambert Conic Conformal projection.
You can read more about projection here, but basically it is a way to flatten a spherical surface (the Earth) onto a plane (the map).
We are going to convert the data from the Lambert Conic Conformal projection to latitude and longitude coordinates.
The map is unprojected when latitude and longitude coordinates are used.
Okay, now it's time to convert.
ogr2ogr
The docs for ogr2ogr can be found here.
First let's look at the projection metadata, which is in the .prj file.
If you open ZIP_CODE_040114.prj you will see that the projection is Lambert Conformal Conic.
PROJECTION["Lambert_Conformal_Conic"]
With GDAL we need to update the projection in the .prj file to "Lambert_Conformal_Conic_2SP”.
That is the supported version name - see the docs.
So just make that change in ZIP_CODE_040114.prj and save the file.
Now we are ready to convert the map coordinates, as well as the file format into GeoJSON.
ogr2ogr -f GeoJSON -s_srs ZIP_CODE_040114.prj -t_srs EPSG:4326 zipcodes_nyc.json ZIP_CODE_040114.shp
- The
-f flag indicates the format for the output, which is GeoJSON.
- The
-s_srs flag specifies the source file spatial reference system (SRS) which is the projection we are starting with, and ogr2ogr can parse the file ending in .prj and get the projection from it.
- The
t_srs flag specifies the SRS that we are converting to, which in this case is EPSG:4326, which represents latitude and longitude coordinates.
- The output file name, zipcodes_nyc.json.
- The input file name, ZIP_CODE_040114.shp.
Each spatial reference system has an EPSG code, and the code for geographic coordinates is 4326 - read more here.
Now you should have a file zipcodes_nyc.json that is ready to go.
Merry Map-Making!
If you have questions or comments, feel free to write them below or reach out to me on Twitter @LVNGD.
And please show me any interesting maps you make as well!